Contents
In a rush?
Download the PDF for later
Introduction
These days, you’d be hard-pressed to find a product manager who doesn’t believe in the importance of collecting and analyzing product data. Being data-driven is no longer an exception or some fringe movement, it’s the rule—the new normal. And the product leaders who can get the best product data and glean the most insights about their customers are the ones who will gain a competitive advantage.
As we discovered in our survey of 200 product managers and executives, companies with the most advanced product analytics programs see annual recurring revenue (ARR) that is, on average, two times higher than those with less developed programs. For modern product teams at product-led companies, the value is clear: Better measurement informs better experiences, and better experiences produce more successful customers. But as a product leader, how do you know which data you should pay attention to? And how do you figure out your product’s key performance indicators (KPIs)?
Whether you’re an aspiring product manager or a seasoned product executive, the metrics outlined in this guide will advance your career. For emerging pros, think of these metrics as the foundation of your product analytics program. For chief product officers, think of this guide as your annual product analytics checkup. If you can tick all 10 of these boxes, you know you’ve got the core data you need to provide continuous value to your customers — and organization.
Editor’s Note: We hope you find the charts and graphs in this resource helpful. The data visualized throughout is mock, and the customer quotes, feature requests, and roadmap items are all hypothetical.
01 Product Stickiness
Do my users keep coming back?
Most companies pay close attention to their ability to add new users and close new customers. Acquisition metrics dominate executive meetings for a good reason: they’re essential for understanding growth. But it’s also important to remember that while companies may buy your product, it’s their people that use it. That’s when the buying journey transitions to the product journey. It’s the stage where your product takes on a more central and powerful role in the brand experience.
As a product leader, it’s your responsibility to build a product that not only attracts new users, but also ensures they continuously re-engage with it.
That’s product stickiness–the infinite loop of user value begetting enterprise value.
If a product is sticky, users don’t just sign up and log in periodically, they live inside the product. It becomes part of their daily professional life.
How to Measure Product Stickiness
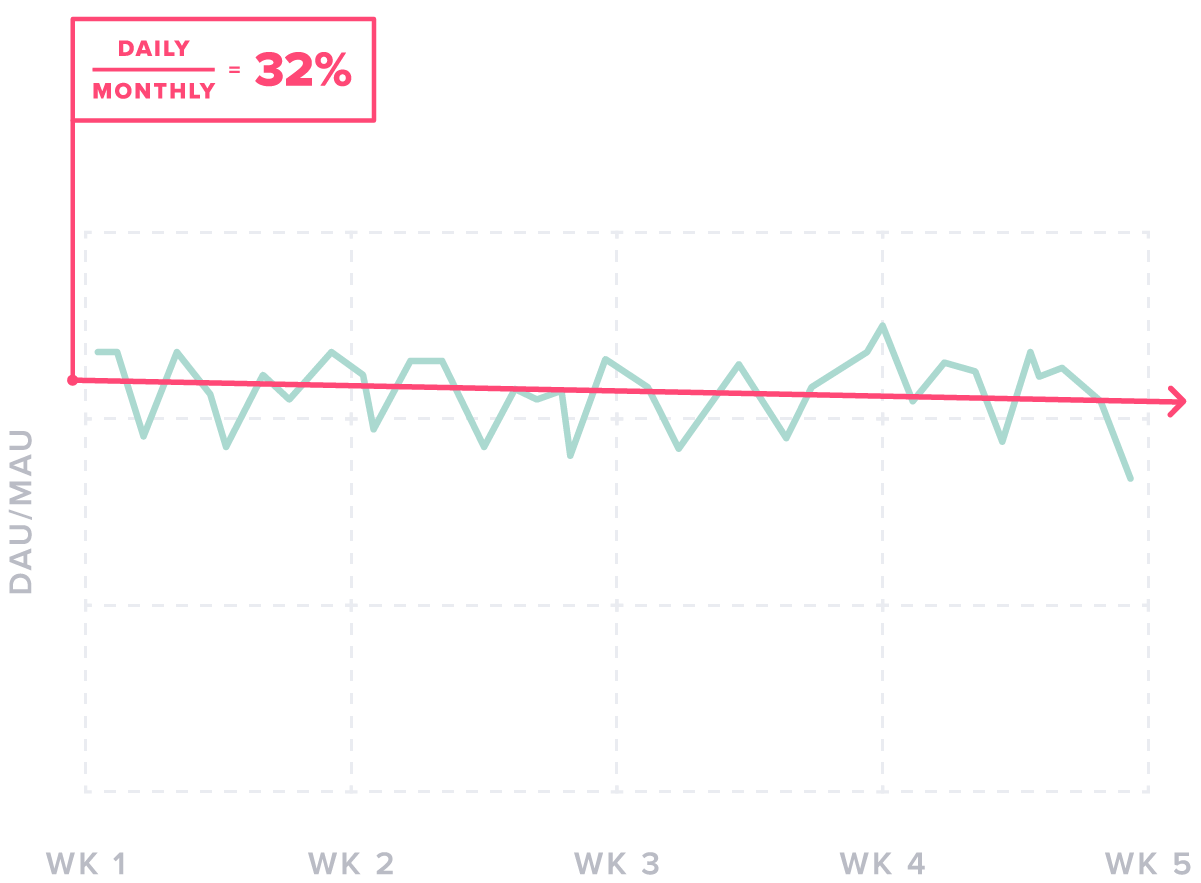
To increase product stickiness, you first need to be able to measure it. The good news: There’s a formula for that. Just take the ratio of your daily active users (DAU) to monthly active users (MAU). The result is your “stickiness score,” the percentage of your monthly users who engage with your product daily.
A related stickiness metric you can look at is the ratio of weekly active users (WAU) to MAU. Same concept, different time frame. Generally speaking, with both ratios, the higher the percentage, the stickier the product. However, your ability to increase your score, and understand what changes impact it, is arguably more important than the absolute
score itself.
02 Product Usage
Are my users and customers engaging with the product as expected?
With any product, some features will inevitably emerge as your most popular and most used, while other features will inevitably sink to the bottom (and sometimes not the ones you’d expect). That’s why it’s so crucial to measure product usage. As a product leader, it allows you to diagnose the parts of your product that need the most attention so you can work with your team to make improvements.
For best results, you need to build a plan for each of your features, paying special attention to those with the lowest engagement. In some cases, you may discover that adoption could potentially take off with a little more promotion and awareness. In other cases, a redesign might be in order. And still in other cases, the best course of action may be to sunset a feature altogether.
Ultimately, whatever changes you decide to make (or not make) to your features, it all starts with understanding usage. You need data to steer you in the direction of where the product experience is delivering—and where it’s falling short.
How to Measure Product Usage
At Pendo, we rely on three key indicators for measuring the health of our product usage: breadth, depth, and frequency. Collectively, we call them BDF. By using the BDF framework, you’ll be able to get a holistic assessment of your product’s health. And by calculating a BDF score for each of your features, you’ll be able to compare feature usage in an objective, insightful way.
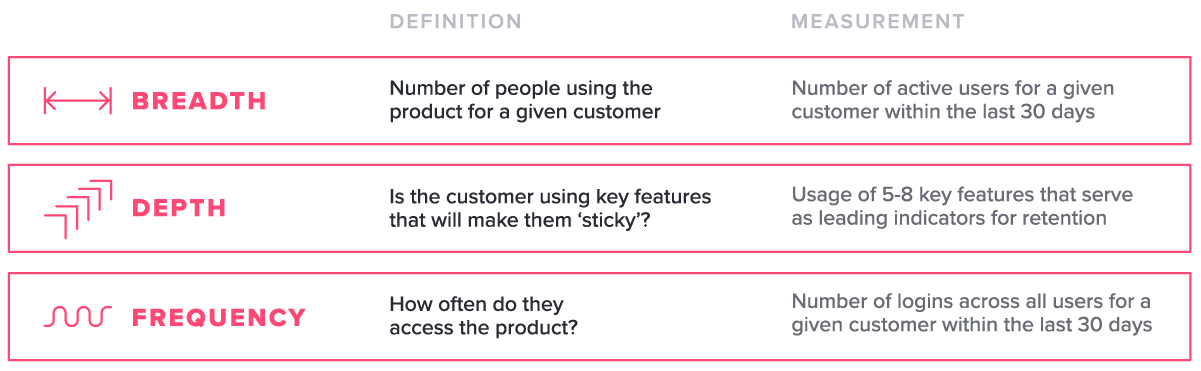
Source: Pendo Blog
Note: For a more in-depth look at how you can calculate BDF score (as well as a free Excel template with pre-loaded formulas), visit the Pendo Help Center.
03 Feature Adoption
Are my users and customers adopting my new features?
As a product leader, your first step when it comes to setting feature adoption goals should be to look back at your most recent feature launches and study adoption rates. Instead of picking numbers randomly, use your product analytics to look back at the dates of your most significant launches and see what percentage of users and customers initially adopted those new features. You should also note the degree of drop-off after the promotional campaigns surrounding these launches tapered off.
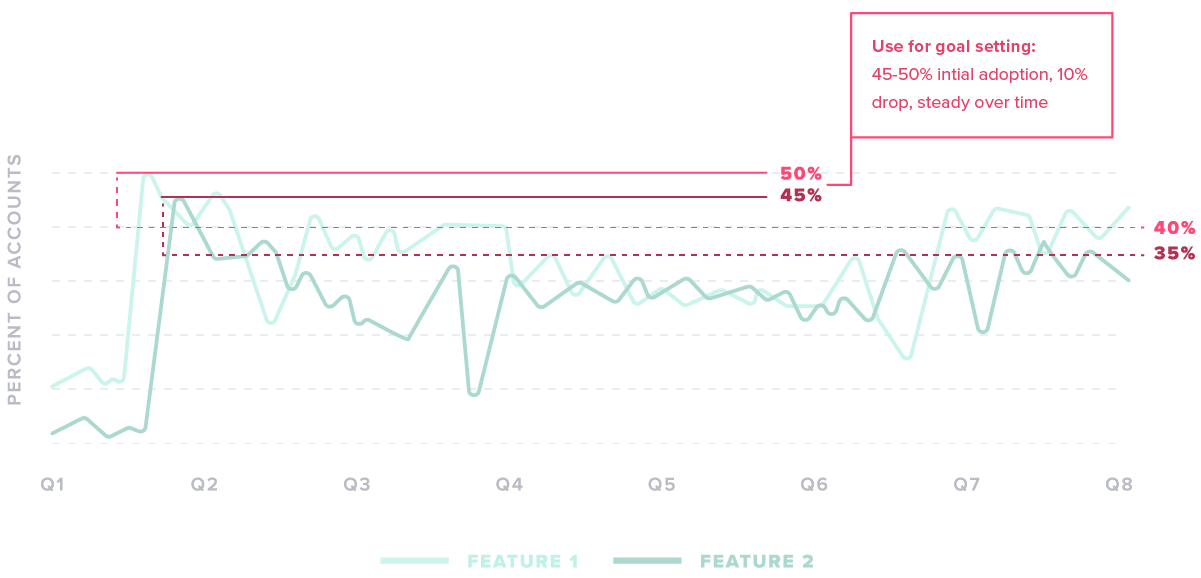
Below is a hypothetical example:
Let’s say we recently looked back at two major feature launches and found that they had initial adoption rates of around 45% and 50%. But once our marketing campaigns cooled off, those rates dipped about 10% before stabilizing. That’s the type of data we like to gather before setting goals for future feature launches.
How to Measure Feature Adoption
This one’s pretty straightforward: Look at the historical data in your analytics tool and compare adoption rates for your most recent launches. You should also look at feature retention rates 30 days following a launch to better understand drop-off patterns.
Persistence pays off when measuring feature adoption. For example, MemberClicks, a company that provides membership software for associations, released a new search feature and surveyed customers who had used it seven times. After each round of feedback they would iterate on the feature, striving for continued improvement. Ultimately, users ranked the feature 4.6 on a 5-point scale.
Be sure to look at feature adoption at the user level as well as at the account level. While measuring feature adoption at the user level will allow you to better understand the behavior of your target persona, measuring feature adoption at the account level (i.e., the company) will help you separate out those who may not have needed the offering because of their role.
To get a full picture of feature adoption, you should strive to measure both ways.
04 Feature Retention
Are my users building enduring habits inside my product?
If you’re reading this guide, there’s a good chance you already understand how hard it can be to get users to remain active after their initial enthusiasm subsides. Becoming part of your users’ daily lives is hard work. But, as you learned in Section 1, measuring product stickiness is a great way to better understand
how you can predict (and prevent) user and account churn. The same principle holds true at the feature level: By understanding which features keep your users returning, you can take specific actions to increase usage frequency.
Ultimately you want users to derive value from a broad set of your product’s features. The fewer features they consume, and the less often they consume them, the more exposed your relationship becomes. By monitoring feature retention, you can identify at-risk users and surface for them features that will help them become more successful.
How to Measure Feature Retention
We’ve found that vital product insights often surface when you compare feature retention across different segments. After all, different types of people and different types of companies will inevitably use your product somewhat differently. The important thing is to analyze those different segments (e.g., free vs. paying, startups vs. enterprises, individual contributor vs. executive) so you can determine how their product behaviors differ.
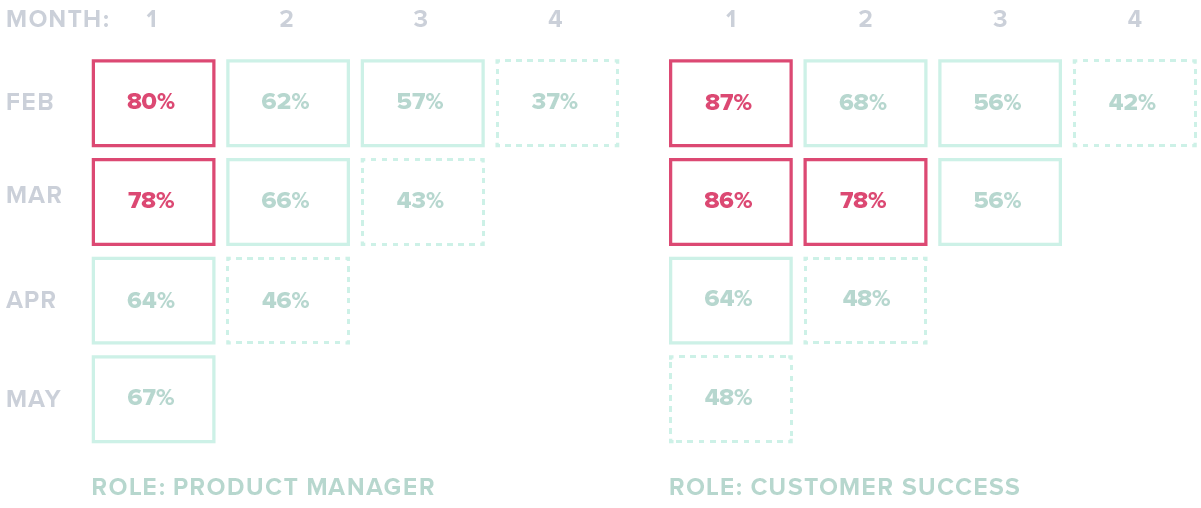
Above: mock data heatmap showing retention for a feature by role, customer success vs. product
For example
At Pendo, we like to measure feature retention by role (e.g., product managers vs. customer success managers) so we can understand if our planning assumptions about feature-persona fit were correct.
05 Net Promoter Score (NPS)
Are my users and customers happy?
Net Promoter Score (NPS) is one of the most popular ways companies gauge customer loyalty. In a recent Pendo survey, we found that 57% of product managers are actively using NPS to understand how likely their customers are to recommend their product to others, a reliable proxy for loyalty.
How to Measure NPS
Here are two key points to keep in mind when measuring NPS:
- Survey over time instead of looking at a static snapshot.
- Measure NPS at both the user level and the account level.
Let’s unpack that second point a little bit more.
By measuring NPS at the account level, you’ll get a broad view of how willing your customers are to recommend your product. Then by plotting accountlevel NPS against product usage and account size, you can unlock actionable insights into which customers may be at the highest risk of churn. What’s more, you can pinpoint the accounts where you don’t have an NPS score, which will prompt you to reach out and find alternative ways to gauge the sentiment of those accounts.
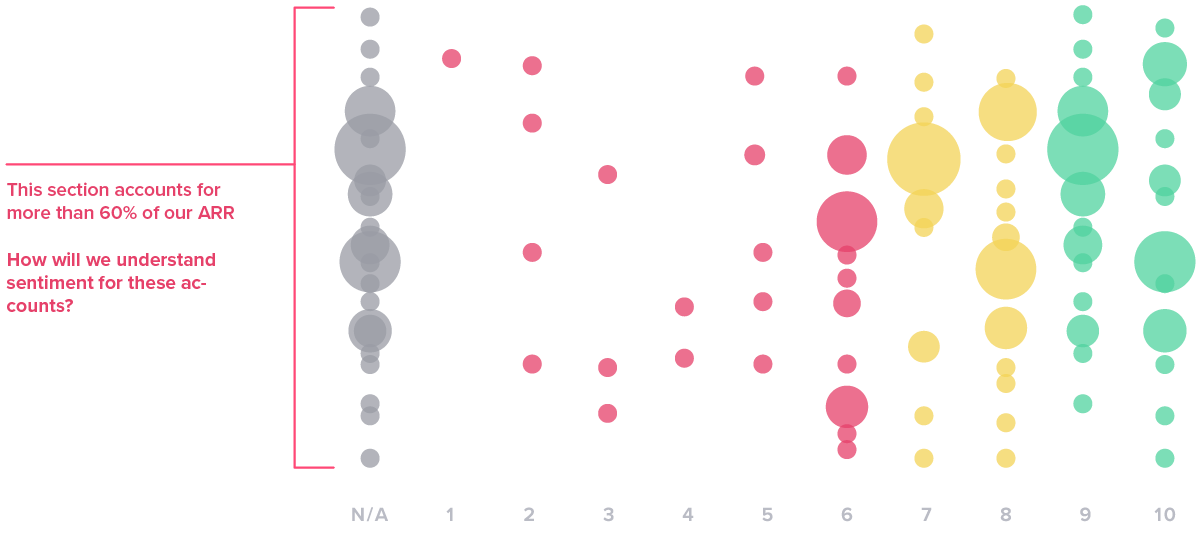
Above: example of a scatterplot that uses NPS to highlight at-risk accounts
Messaging customers as they use your product is an effective way to increase response rates. Recruitment and applicant-tracking software provider SmartRecruiters had little idea how customers were using its product, so it replaced email surveys with an in-app NPS survey that it served to active users. This resulted in a 1300% increase in participation, and the feedback helped SmartRecruiters identify long-term trends and improve its product.
User-level NPS allows you to get a sense of sentiment within your target persona. Since you designed your product for this very persona, expect user NPS scores to exceed account-level scores.
In order to get the most out of user-level NPS, be sure to include a section in your NPS survey that asks for written comments. These “verbatims” can provide valuable context for the numerical score.
Lastly, NPS is an excellent way to identify potential brand advocates. Savvy companies reach out to their promoters and ask for reviews or references; doubly savvy companies also reach out to their detractors to learn why they aren’t delivering an ideal product experience.
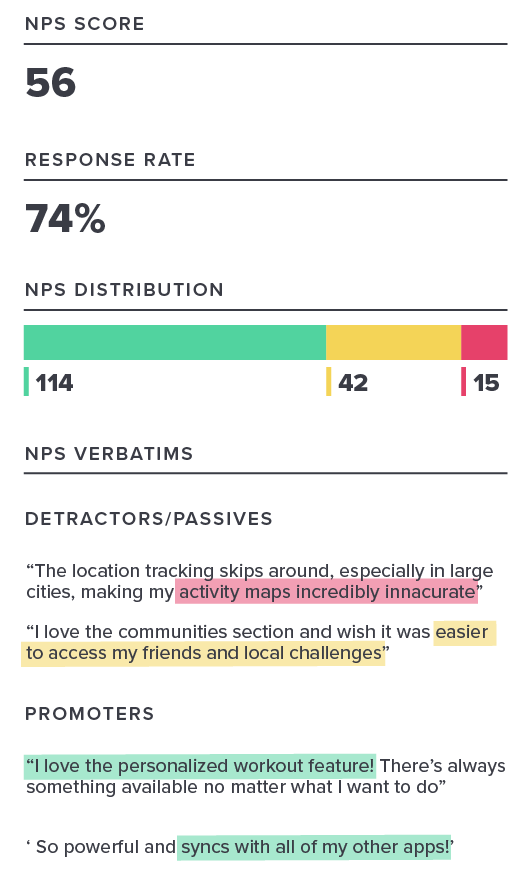
Above: NPS scores and verbatims using mock data
06 Leading Indicators
Do I understand the leading indicators of conversion, renewal, and expansion?
The best product leaders have a strong understanding of what’s driving positive business outcomes. Specifically, they know which usage patterns correlate to account growth and renewal. By identifying leading indicators at your business, you’ll have the insight necessary to nudge people toward the features and behaviors that have led their peers to success. You’ll also be able to tailor your onboarding experience to foster the healthiest usage habits early.
How to Measure Leading Indicators
A popular technique among Pendo customers is exploring whether users at accounts that later renew behave a certain way in their first 90 days. The same basic approach can apply to converting trial users to paying customers.
Citrix ShareFile’s product team, for example, identified three basic tasks that successful users of the file sharing solution consistently completed during trial: sharing a large file, sending an encrypted email, or uploading files quickly to the cloud. To improve the experience for new users, the company created a walkthrough where users could choose the task they wanted to complete. Through this process, they increased their trial conversion rate by 11 percent.
07 Top Feature Requests
Do users want the same thing from my product?
Anyone who’s spent time working in product can tell you: the requests never stop coming. There’s always a steady stream of new ideas pouring in. And with so many unstructured requests arriving via so many different channels (e.g., email, live chat, support tickets), making calculated product decisions can, at
first glance, seem impossible. As a result, some product leaders end up ignoring user feedback altogether, which is just trading one problem for another.
While it’s not necessarily crucial for product leaders to scrutinize every little suggestion that bubbles up, high performers pattern match requests and invest time where there’s density.
How to Prioritize Feature Requests
While different companies will take different approaches to prioritization, there is a universal principle common to most successful organizations: centralization. Your initial goal should be to create a centralized system where all of your feature requests are stored. This will make it considerably easier for you to understand which feature requests are surfacing most often. And, by analyzing feature requests at the user- and account-level, you’ll be able to identify patterns that can help with the prioritization process.
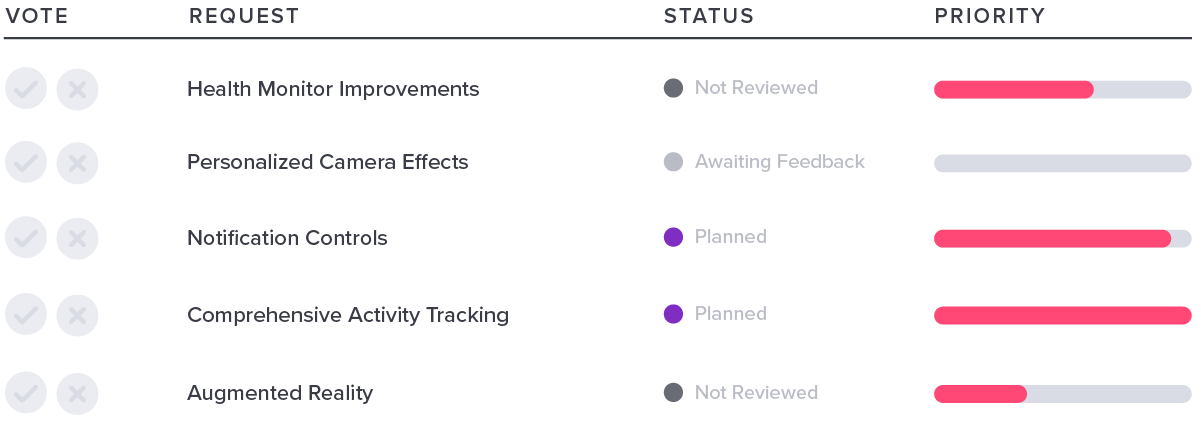
Above: an example of a tool that centralizes and helps prioritize feature requests.
Pro tip: Want to avoid getting overwhelmed by the volume of feature requests? Let your existing product strategy be your guide. Users are unlikely to understand fully your roadmap, resources, or business strategy. Perhaps their ask exceeds your bandwidth. That’s why it’s important to take a top-down approach to prioritizing feedback. To quote the Receptive blog,
“Rather than haphazardly rummaging around for insights, a top-down approach is far more effective. You have to change your product backlog into a feedback library.”
And finally, regardless of how you manage your feature requests, always be sure to close the loop with the people who share feedback. It’s not enough to simply analyze what users have told you; you have to let them know that their voices have been heard.
Why There’s No Replacement for Qualitative Data
While the primary focus of this guide so far has been on using quantitative data to make better product decisions, it’s important to keep in mind the value qualitative data. The former shows us what our users are doing, but the latter helps us understand why they’re doing it. Without qualitative data, the voice of the user would be missing from the decision-making process. Although making inferences from behavior is vital, the best insights come from a combination of what customers say and what they do. Context is essential.
08 Product Delivery Predictability
How reliable is my product roadmap?
In addition to being able to predict how users will behave, a strong product leader can also anticipate how her team will perform. Without that predictability, you, as a leader, run the risk of publishing a roadmap that your team can’t rely on.
Of course, part of the reason for publishing your roadmap is to create a sense of accountability within your team and alignment with adjacent functions, particularly R&D. That’s why it’s essential that your roadmap blends art (what your experience tells you is possible) with science (what the data indicates is probable) to paint a realistic picture of the future.
How to Measure Product Delivery Predictability
Here’s a scenario we’ve heard from product leaders in our network: The executive team reviews a product roadmap dashboard every two weeks (assuming two-week sprint cycles). The product team measures predictability by taking the ratio of the number of story points completed to the number of story points originally committed to. The resulting percentages reveal, roadmap item by roadmap item, whether the team is behind, on schedule, or ahead of schedule. As a product leader, you can use those types of findings to build a more informed roadmap—one you can have more confidence in.
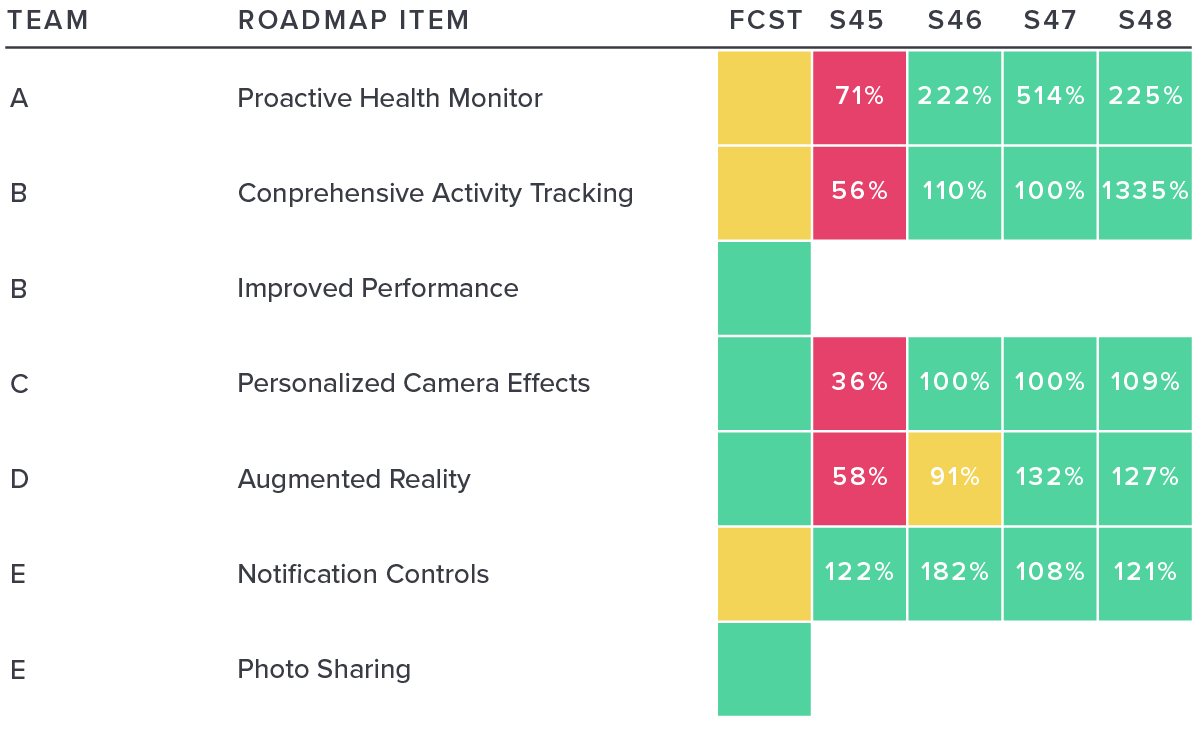
Above: an example of a product roadmap snapshot for 2018
09 Product Bugs
Am I maintaining product quality and efficiency?
For most digital product teams, bugs are inevitable. But having a few bugs pop up here and there doesn’t mean your product is substandard. (And, conversely, having zero bugs doesn’t necessarily mean users are going to love your product.) When it comes to bugs, the most important thing isn’t whether or not
they arise, but rather how you deal with them.
The best product leaders don’t necessarily prevent bugs, but they do ensure they’re caught and fixed in a timely manner.
How to Measure Product Bugs
There are two measurements that can be really helpful here. The first is to look at a breakdown of product bugs by feature. That way, you can pinpoint the buggies parts of your product and devote more resources to fixing them. However, when prioritizing which bugs you’re going to fix first, it’s also important to consider product usage. In order to deliver the best product experience to the greatest number of users, you should prioritize bugs found in the most heavily used areas of your product over those found in less popular areas.
The second measurement is the number of bugs reported versus the number of bugs you’ve fixed. This is something you can chart over time. In a perfect world, you’d resolve bugs as quickly as they arose so that your net bug count would remain at zero. Unfortunately, that’s not the world we live in, which is why you need to track bugs reported versus bugs fixed–or net bugs. As a product leader, this allows you to evaluate how well you’re maintaining the quality and efficiency of your product.
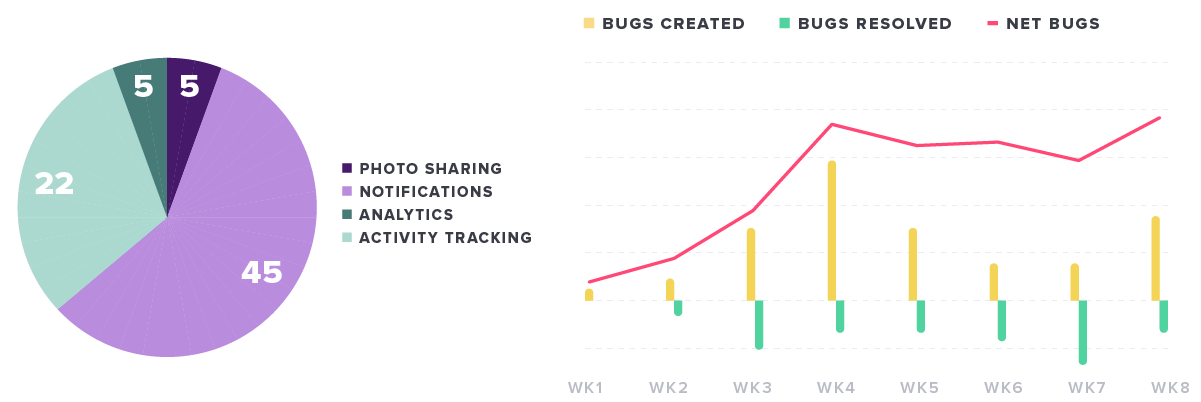
Above: a pie chart showing breakdown of bugs by feature and a line chart showing net bugs over time
10 Product Performance
Is performance really a top priority?
In today’s on-demand, one-click world, where you can buy just about anything online and have it delivered to your door in hours, people have come to expect products to work and work fast. This expectation is especially acute in SaaS, where products perceived to be slow fall out of favor quickly. Even if users find
your product to be valuable, they’re always just one renewal cycle away from going with a competitor who can deliver a similar experience, but faster.
How to Measure Product Performance
To make product performance a top priority for your team, you need to set a goal for how quickly your product can return requests. You may want to identify an acceptable performance standard (say requests delivered in five seconds or less) and then hold yourself accountable to maintaining that standard for a sizable portion of your customer base or a sizable percentage of all requests. Establish an internal performance benchmark, and then measure yourself against it monthly or quarterly.
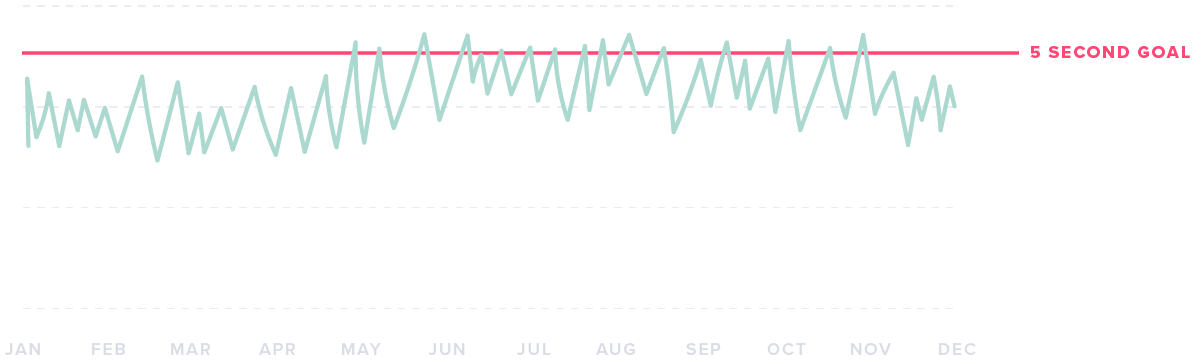
Above: hypothetical product performane over time charted against a 5-second goal
THANKS FOR READING
We hope this guide helped you better grasp the essential metrics that product leaders need to understand if they’re to deliver maximum value to their organizations. As products continue to shift toward becoming the centers of gravity for more businesses, product leaders will continue to gain more influence and authority. This presents a major opportunity for aspiring (and existing) product leaders to step up and lead their companies into the future. But in order to do so, they need to be armed with the right data.
To learn more about how you can use data to better understand and guide your users, visit Pendo.io. From product analytics to user onboarding to guided engagement, Pendo helps you create product experiences users can’t live without.