
Inhaltsverzeichnis
In a rush?
Download the PDF for later
Robust product data can have a significant impact on both product and business success according to our recent survey of nearly 200 product teams. Asked to evaluate the state of their analytics programs, the performance of their best applications, and their relative performance with peers, those with the most advanced analytic programs consistently reported the best results. These companies reported higher ARR, greater profitability, higher growth, and lower customer churn than their competitors. While most respondents recognized the importance of measuring product performance, a significant number of them currently collect little or no product data at all. Companies that invest to establish a strong analytics program can achieve product success and differentiate themselves in the market.
In a world where big data and analytics are increasingly embraced across business disciplines, it’s easy to assume that the product teams from technology companies would be at the forefront. In a 2015 survey of CEOs, PwC found that 89% of them reported receiving ‘very high’ value from digital technology-driven data and analytics.1 We were interested to see how much of that analytic investment and organizational prowess makes it’s way to the product teams. To find this out we surveyed 197 product managers, executives, and other team members (UX, customer success, support) to explore what elements of their applications were regularly analyzed, and whether richer analytic programs had any impact on performance and competitiveness.
Survey methodology
We focused our research on technology organizations in North America. Over a 3 week period in January 2016, we reached out to product team members from consumer and business-facing companies ranging in size from $500,000 to over $250 Million in revenue. The profiles broke down as follows:
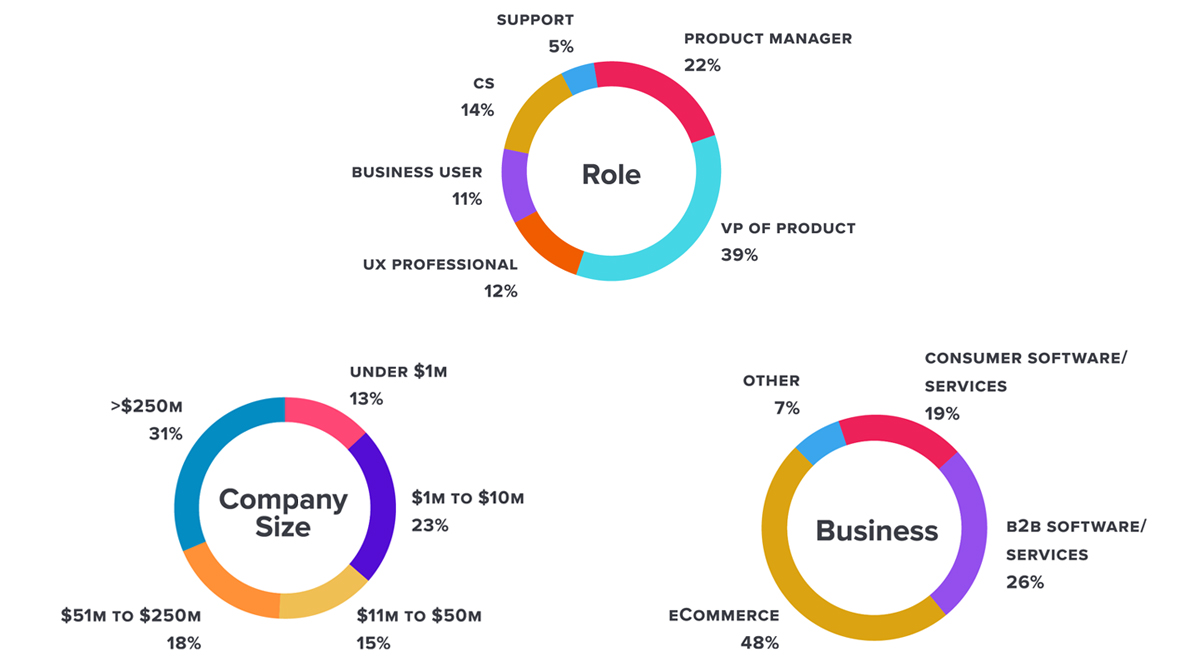
The majority of respondents were in either a product manager or executive role– 58% with a smaller representation of other roles. Businesses were split between commercial software and eCommerce, and company size varied from very small, early stage companies to large enterprises.
Product Data a missed opportunity
As expected, most respondents recognized the importance of tracking product analytics. Eighty-one percent of respondents reported that they currently track analytics, or have a desire to do so. However, out of those who do currently track analytics, the number of respondents who do so at a high level was quite a bit lower.
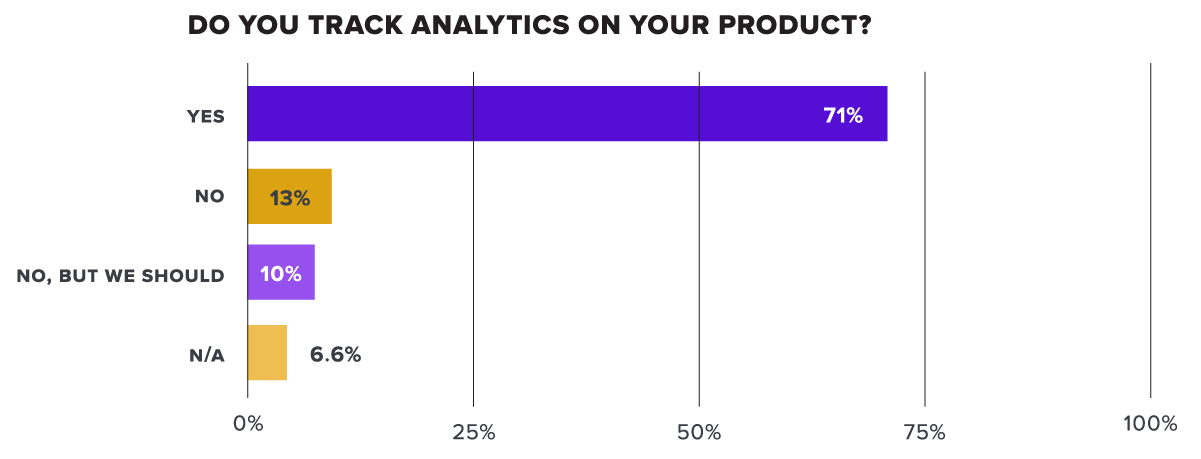
The majority of respondents did indicate some level of measurement, but nearly a quarter reported that they did not currently track any analytics on their product. The responses varied across types of businesses.
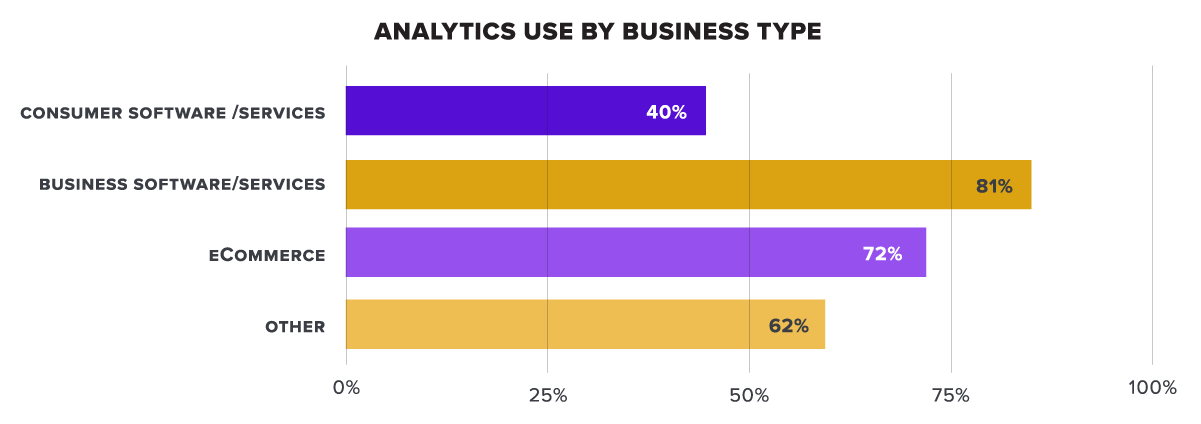
Over 80% of B2B software companies and 70% of eCommerce companies reported some level of product analytics, while consumer software companies lagged far behind at 40%. Consumer products companies likely have access to detailed market and customer research through other channels which may be taking the place of analytics within the product.
Following the “Yes/No” question, we asked survey respondents to select which of the following dimensions they measured: pages, features, accounts (customer-level), and visitors (user-level) in their applications. These different elements provide a baseline of product data that allows companies to understand the breadth and frequency of use in their applications. Page and feature-level analytics provide information about the overall volume of use, and account and visitor measurements allow companies to know who is logging into the application, how often they come in, and how much time they spend in the application. The responses were about even across all types of measurement, but many respondents reported only measuring one or two of the items.
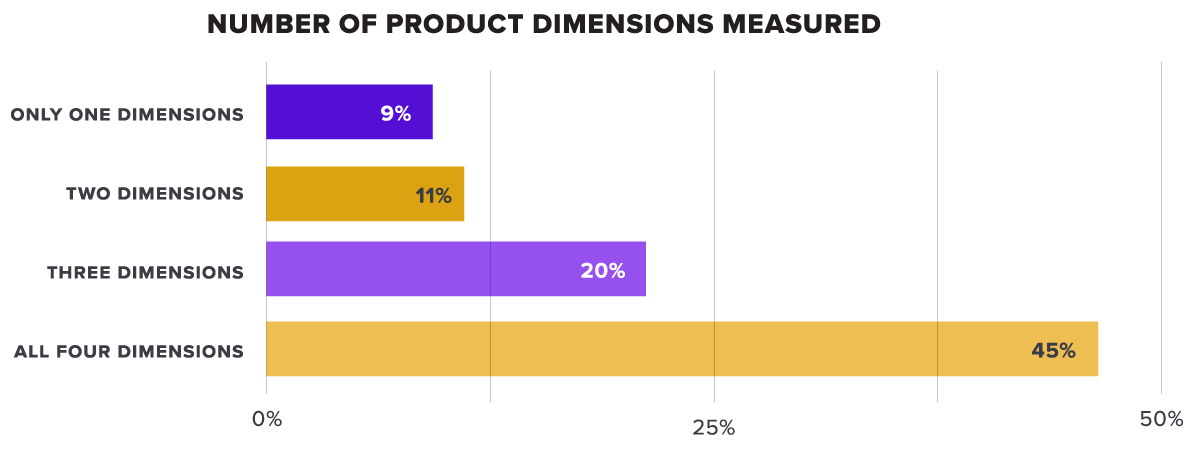
Of those that indicated an analytics program, less than half of them reported measuring all four core dimensions of product analytics. Over 20% of those with an analytics program reported that they only measure one or two of the dimensions indicating a potential maturity gap across different companies’ programs.
Advanced measurements depth and efficiency
The maturity gap increases when looking at some more advanced product key performance indicators. In addition to the basic measurements, we asked about the extent that users measure depth of usage and user efficiency as part of their analytic programs. Depth of usage looks at what percentage of core features are used by the average user, and efficiency looks at how often users complete common tasks after starting them (a good measure of usability).
Measuring depth requires two steps. First the product team must establish which set of features are “core” to the customer experience—the ones that make up the major functionality of the application and are regularly used by the most successful customers.
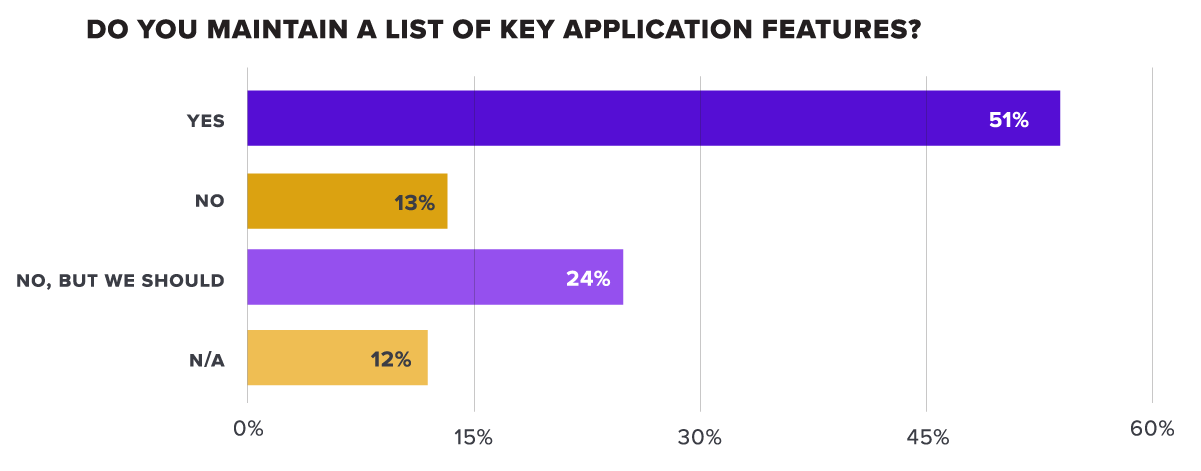
Only about half of the respondents reported that they currently use this practice, but another 24% recognized the importance of maintaining this feature list. The second part of the depth measurement looks at what percentage of the key features are regularly used in the application.
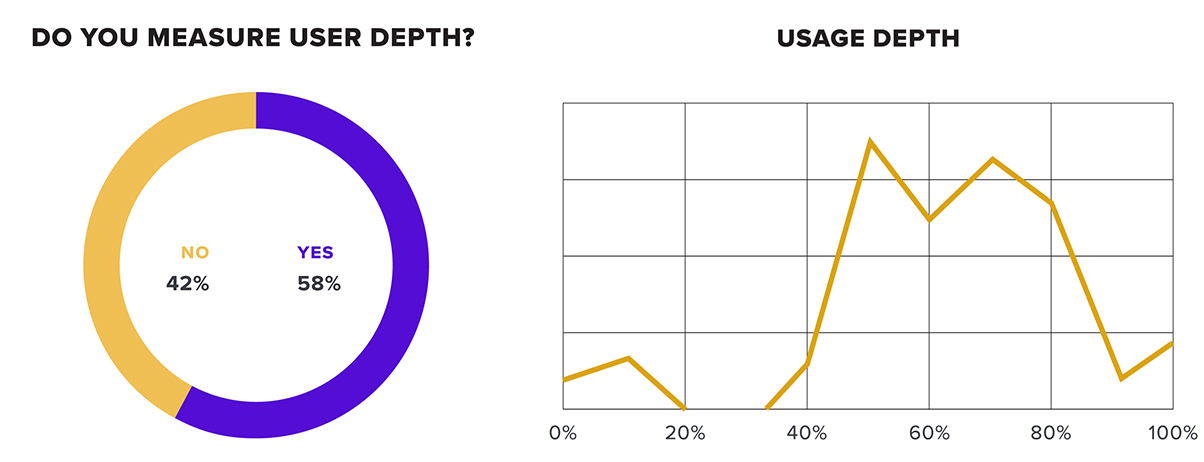
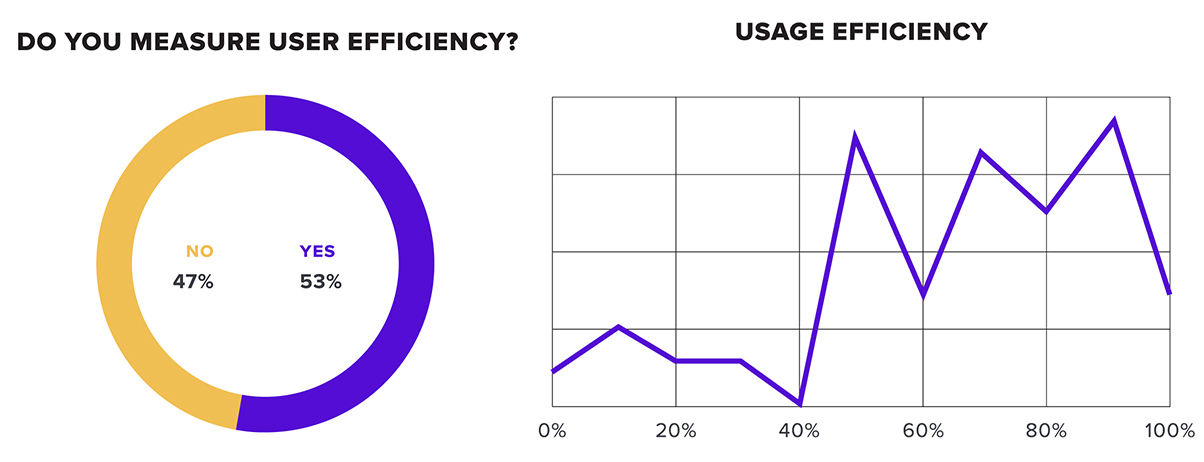
Again, only about half of the respondents reported that they currently track this metric. Those that did averaged about 60% usage of their key features. We saw a smaller percentage of users reporting that they measure user efficiency. However, of those that do, the average efficiency rate was higher—by nearly 70%. These companies are likely heavily focused on the user experience and as a result are driving strong results in this area.
Looking across the board at measurement, there is clearly an opportunity. Nearly a quarter of companies reported no product analytics program at all, while only half reported regularly collecting the types of metrics associated with a mature analytics program. Companies with better product analytics know more about their customers, their individual users, and the ways in which their applications are used. They have a better understanding of the effectiveness of their overall customer experience. They can put that data to use and rapidly differentiate their products in the marketplace.
User outreach and feedback
Another key source of product data is, of course, direct feedback from users. User feedback and user/usability testing is a common practice, but product teams may not necessarily consider it part of their analytic programs. User feedback plays a significant contextual role when trying to interpret observed user behavior. Quantitative analytics show what a user is doing in the application, but the feedback component provides the “why.” The most sophisticated product analytics programs regularly bring these two sources of data together for a more complete picture of both their users and the success of their products. Knowing this, we asked respondents how often they solicit user feedback (if at all).
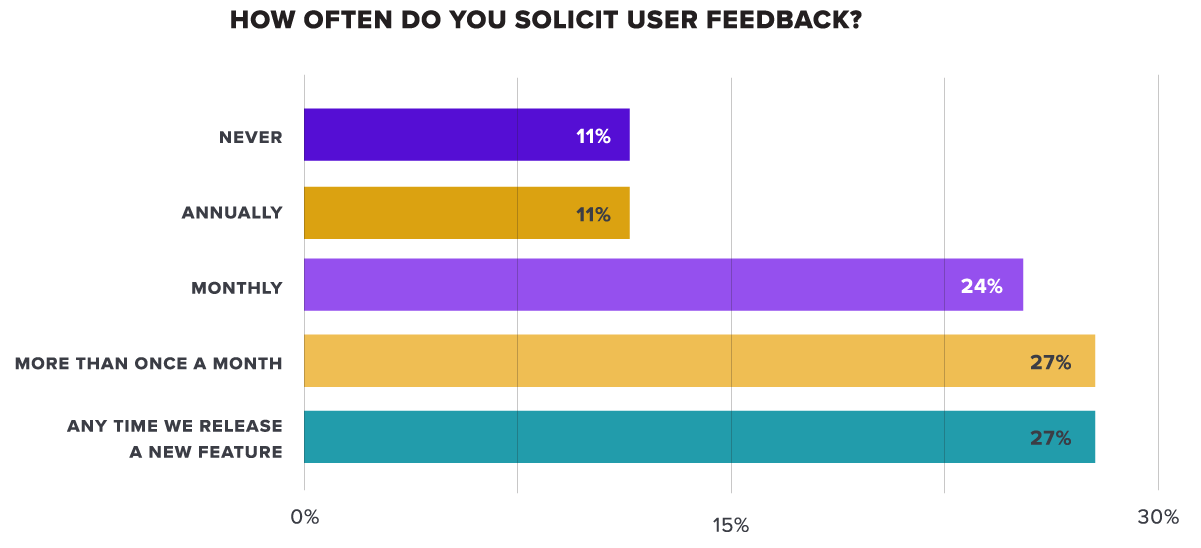
Unsurprisingly, nearly 90% of respondents reported collecting user feedback, and many reported collecting it quite frequently. We also asked whether they used Net Promoter Score (NPS) to benchmark customer satisfaction. Created in 2003 by Bain & Company, NPS is a popular methodology that provides a simple, numerical score of customer satisfaction which is also directly linked to growth potential.
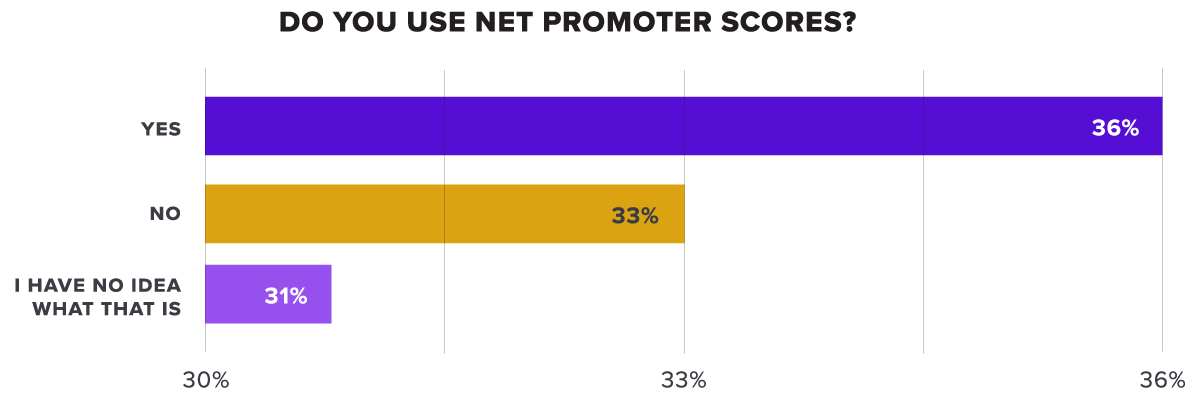
A much smaller percentage of users reported collecting and measuring this specific metric. Nearly two-thirds of users do not currently use it. In addition to the frequency of feedback, we also asked respondents what mechanisms they use to collect user feedback.
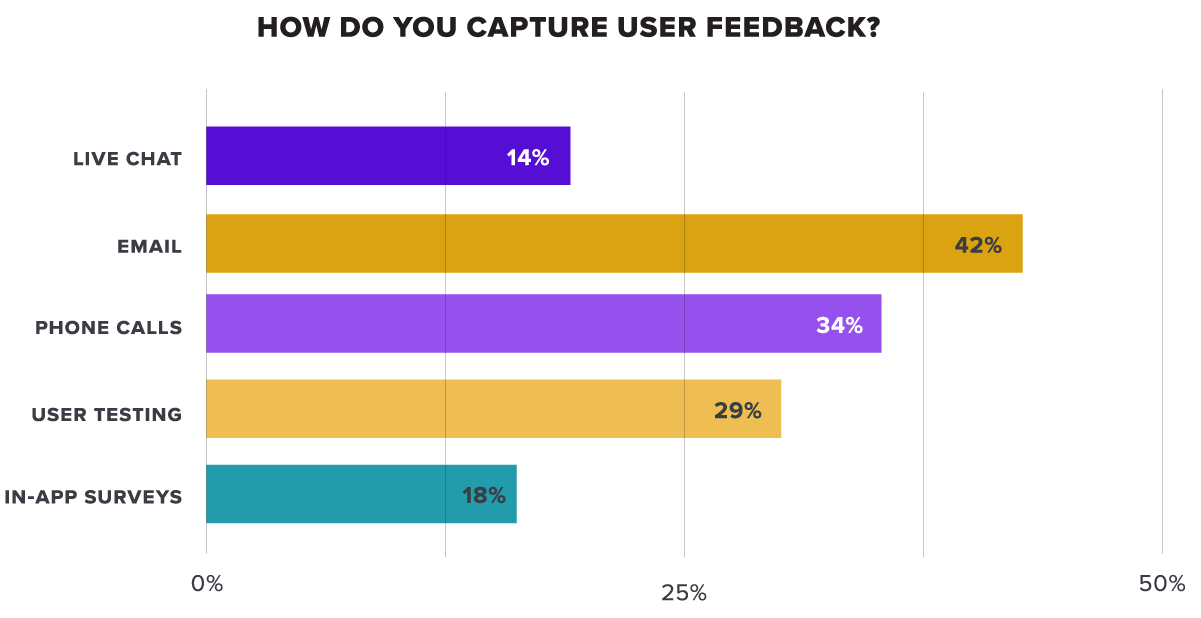
Email was the most used method, followed by phone outreach. Only a small number users reported using in-app surveys or live chat to interact with users. This is another opportunity that companies can seize. Collecting feedback in-app can deliver a 2x-4x higher response rate when compared to email, and because it engages customers when they’re specifically using the app, it often provides much more relevant and detailed feedback.
Product analytics maturity
The results of our survey clearly indicated a varying degree of maturity in the analytic programs that companies have in place. Looking at key attributes – breadth of measurement, advanced measurements, and integration with qualitative feedback, we identified three levels of maturity across the survey respondents:
Novices
37% of respondents
Novices are very early-stage programs without any sophisticated measurement of product use. Respondents at this level reported that they do not capture analytics at all, or if they do, they only measure one of the four basic dimensions of product analytics. For example, they collect product analytics, but they only measure pageviews.
Fundamentals
45% of respondents
Fundamentals reported a more robust analytics program that measures product analytics on multiple dimensions, including feature or account/user- level measurements, along with pageviews. They do not, however, track any of the more advanced measurements, nor do they integrate their analytics program with captured user feedback.
Sophisticates
10% of respondents
Sophisticates had the most advanced analytics programs that brought together quantitative and qualitative measurement. They capture multiple dimensions of core product analytics, and augment the data with depth or user efficiency metrics. They actively solicity user feedback, and use in-app surveys to capture highly-relevant feedback.
Companies with the most sophisticated programs only represent about 10% of the survey respondents, while the majority of respondents fell into either the “novices” or “fundamentals” range.
In both areas the Sophisticates outpaced other companies by a wide margin. Why do these companies have better performance than their peers? The survey also showed that companies with more advanced analytics have more engaged users. Looking at their best performing applications, Sophisticates reported a much higher rate of daily visitor frequency than companies at other levels.
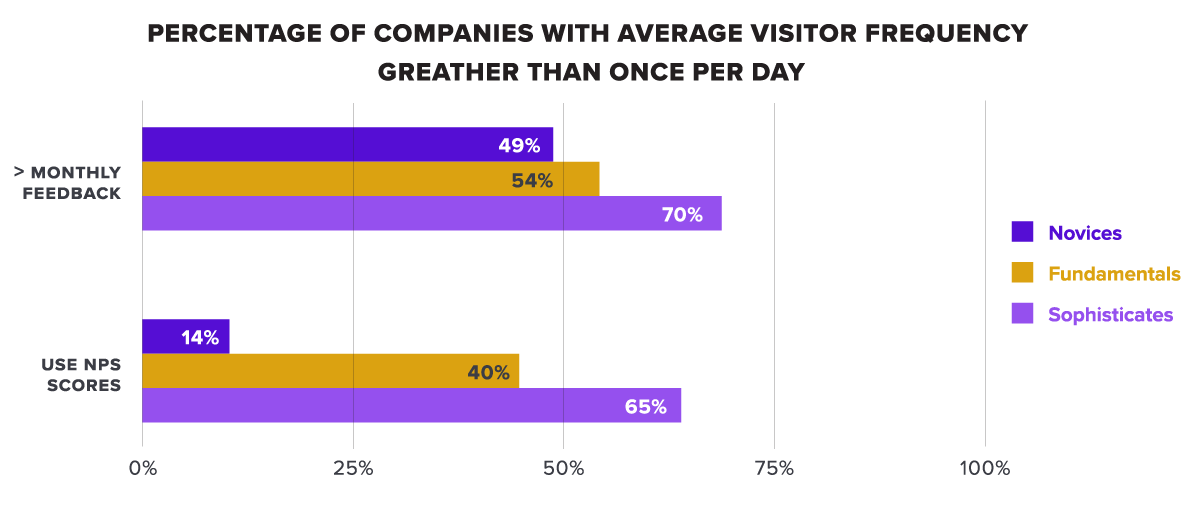
These comparative results show a much tighter and more consistent feedback loop for Sophisticates. They measure more dimensions of their products, and they measure more frequently—typically soliciting user input at a bi-weekly, weekly, or even daily rate. They are able to put this data directly to use—increasing user engagement, and ultimately building products that generate higher revenue.
Recommendations
Based on the survey results there is clearly an opportunity for companies that can accelerate their product analytics capabilities. Those with the most advanced programs were only about 10% of the survey respondents, and they returned twice the ARR of companies with less mature programs. Here are some key recommendations for organizations that are looking to take advantage of this maturity gap:
Understand what you are measuring and what you can measure today. Although currently you may not be measuring many dimensions in your product, that doesn’t mean that you lack the capability to do so. Some minor tweaks or additional instrumentation may enable you to get more detailed data than you currently do. Complete an assessment and understand where you have gaps before investing in a new program or analytics solution.
Look for opportunities to capture more user feedback. The best companies were much more rigorous in the frequency of feedback that they sought. Getting more feedback might not necessarily entail developing a new program. Support tickets, and UX tests are two sources of qualitative feedback that your company is likely collecting today. Begin by mining these to look for areas where customers experience pain.
Bring together qualitative and quantitative data for an integrated view of product data. The greatest returns from product analytics are generated when user behavior and user feedback are analyzed together. Product teams can leverage these views to really understand their users and better prioritize new features and updates.
Consider collecting user feedback in-app. In-app surveys yield much higher response rates, and because they engage users “in-the-moment” they provide more relevant feedback.