
Contents
- Introduction
- 1. App launch and load speed
- 2. App versions
- 3. Battery and network consumption
- 4. Crashes, uninstalls, and active users
- 5. Feature adoption and Core Events
- 6. App store ratings
- 7. Retention rate
- 8. Product Engagement Score (PES)
- 9. Net Promoter Score (NPS)
- 10. Poll and survey engagement
- Thanks for reading!
In a rush?
Download the PDF for later
Introduction
The challenges and opportunities of a mobile-first world
It’s never been easier for users to get up and running with new software. It’s also never been easier for those same users to abandon that software and head for greener pastures when the product doesn’t work the way they’d hoped.
Mobile promised us flexibility and agility—a way for users to accomplish their most important tasks whenever, wherever, on any device. It’s an exciting chance for product leaders to create apps that are omnipresent, and that can deliver ongoing value to users. But mobile also comes with unique challenges.
Your window of opportunity to delight is fleeting and tightly time-bound—often measured in fractions of a second. You have to build with variety in mind, accounting for users accessing your app on all kinds of devices and operating systems. And then there’s versioning—and the struggle to get all your users on your latest release. Plus, time just seems to move faster in the mobile world as deployment cycles are shortened to quickly squash bugs and meet rapidly changing user demands.
With the pace of mobile innovation, it’s more important than ever to use data to make informed decisions—so you can keep pushing your product forward and delivering an incredible user experience. Knowing what key performance indicators (KPIs) to measure—and putting the right systems in place to capture and act on them—is critical. It’ll help you and your team understand which features are working as planned, see where and how your users access and derive value from your app, and capture what your users love most (or least) about your product.
The following is our list of the top ten KPIs all mobile product leaders should track. Armed with this data, you’ll have everything you need to deploy with confidence, delight your customers, and drive competitive advantage from your mobile apps.
1. App launch and load speed
How long does it take your app to fire up?
A user’s very first impression of your mobile app is the amount of time they have to wait for it to launch on their device.
According to Google Think, a one-second delay in mobile load times can impact conversion rates up to 20 percent. For companies leveraging a mobile app to sell products to customers, that could amount to millions of dollars in lost sales. And for those leveraging an app for employee productivity, nothing will inspire your people to find workarounds faster than slow-moving software.
Combined with your onboarding experience, the load speed of your app is your first opportunity to show your users how well your product performs and what they can expect every time they open it.
Tracking the amount of time your app takes to launch—particularly if your data is granular enough to segment by device type, operating system, and app version—will add valuable color to any user sentiment insights and help your team identify where to focus their optimization efforts. While the industry benchmark for ideal app launch and load speeds has evolved, in general, the lower you can get the number, the better the chance of your users sticking around.
Why you should track app launch and load speed:
- Indicative of a great (or not so great) first user experience
- Helps product teams identify speed optimization opportunities
- Has an impact on usage intention and user retention
- Adds context to other user sentiment data
2. App versions
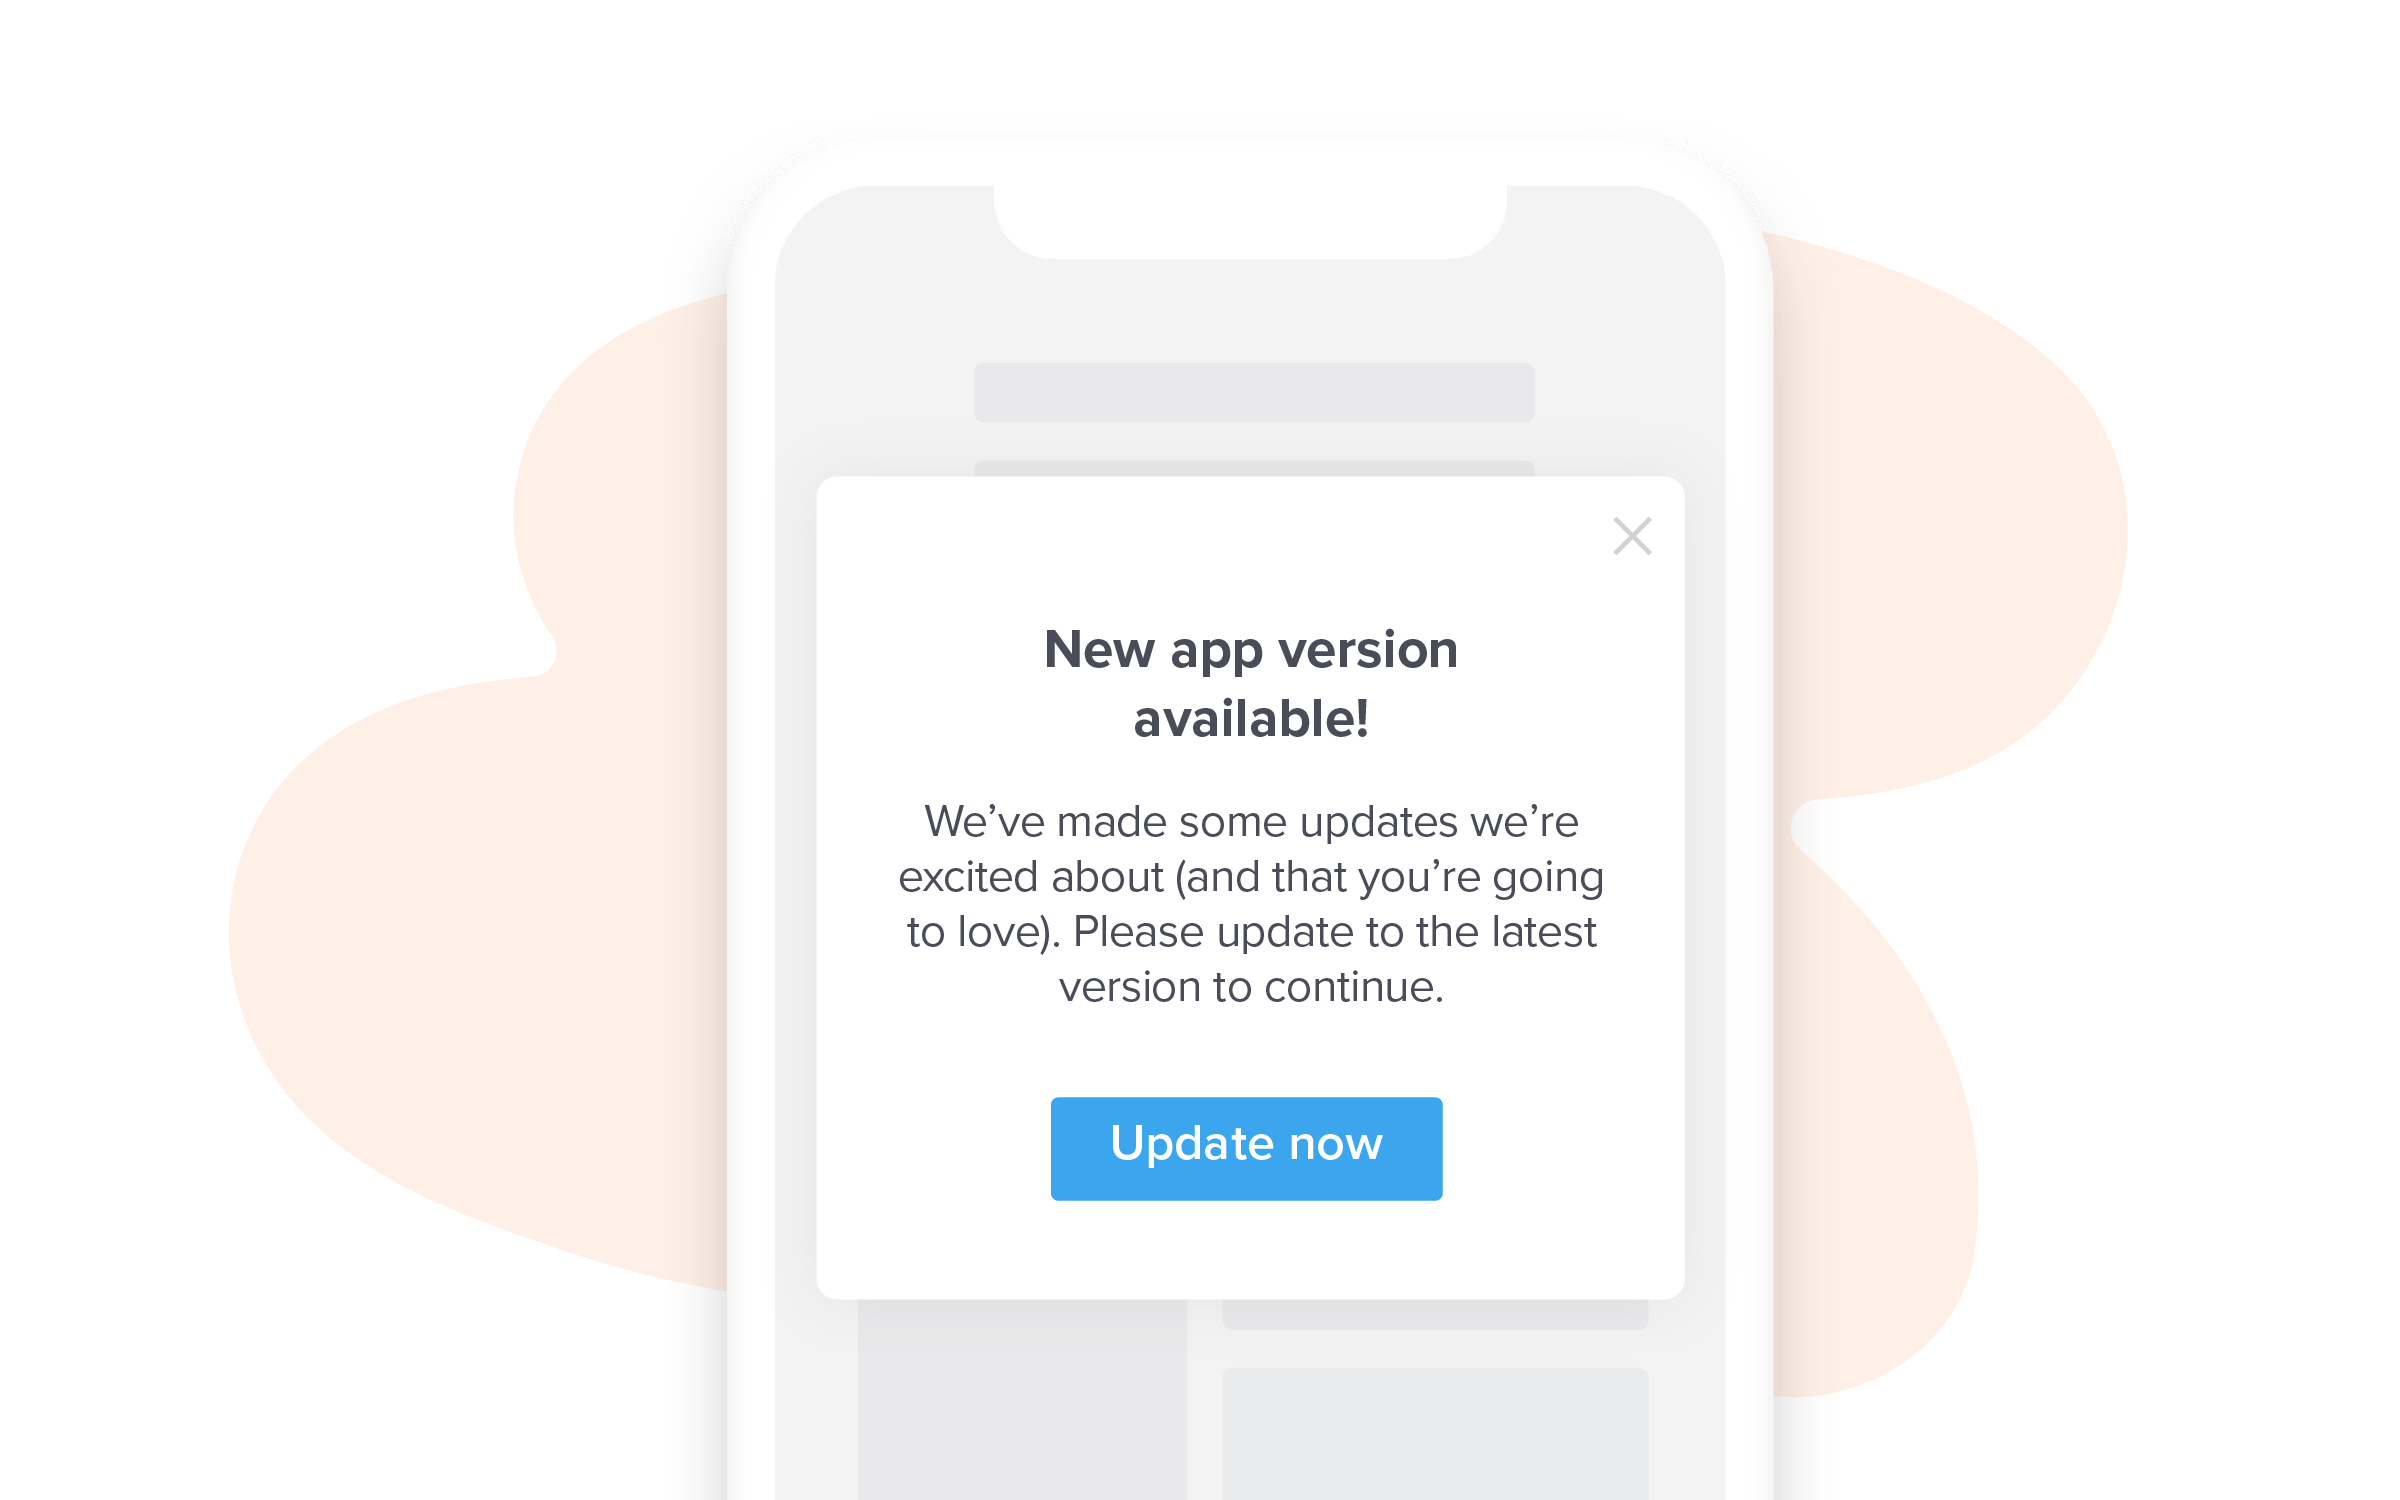
Who’s using which version of your app?
Mobile products face the unique challenge of users updating to newer versions at different paces—which means product teams must support multiple versions at once.
While these older app versions may feel familiar to the customers using them, they can cause a lot of headaches for the teams keeping them afloat. Users on an old app version may run into issues you’ve already fixed in a later release—so they’ll find themselves complaining about problems that aren’t really problems anymore. This bogs your team down with support tickets, causing them to waste valuable time addressing concerns that have already been mitigated.
The challenge is communicating the importance and value of your new app version to your users at scale, and making sure only the people who haven’t yet updated see it. That’s why it’s important to understand the distribution of users across your various app versions. This data will not only help you better segment and target messaging to your users, it will also give you insight into the potential impact your users updating (or not) might have on your resources and product experience.
For example, if you have a few holdouts using an old version of your app, you may be less concerned about getting them on your newest version. However, if a large population of your user base is still on an old version (and missing out on all the great new features and optimizations you’ve made), you’ll probably want to take immediate action to get them onboarded to your latest release.
This data is also useful for further contextualizing other customer feedback. If a user is complaining about a bug or broken feature, you can dig in and find out which app version they’re using. If it’s a problem that’s already been solved in a recent release, you can target them with messaging that encourages them to upgrade to the new version of your app. Or if they are already using your latest version, this could help you get ahead of the issue and quickly introduce a fix.
Why you should track app versions:
- Leads to better user segmentation and targeting (which leads to more effective messaging)
- Less time and resources spent addressing already-solved issues
- Helps you confidently sunset old app versions or push users to your latest release
- Adds context to other user sentiment data
3. Battery and network consumption
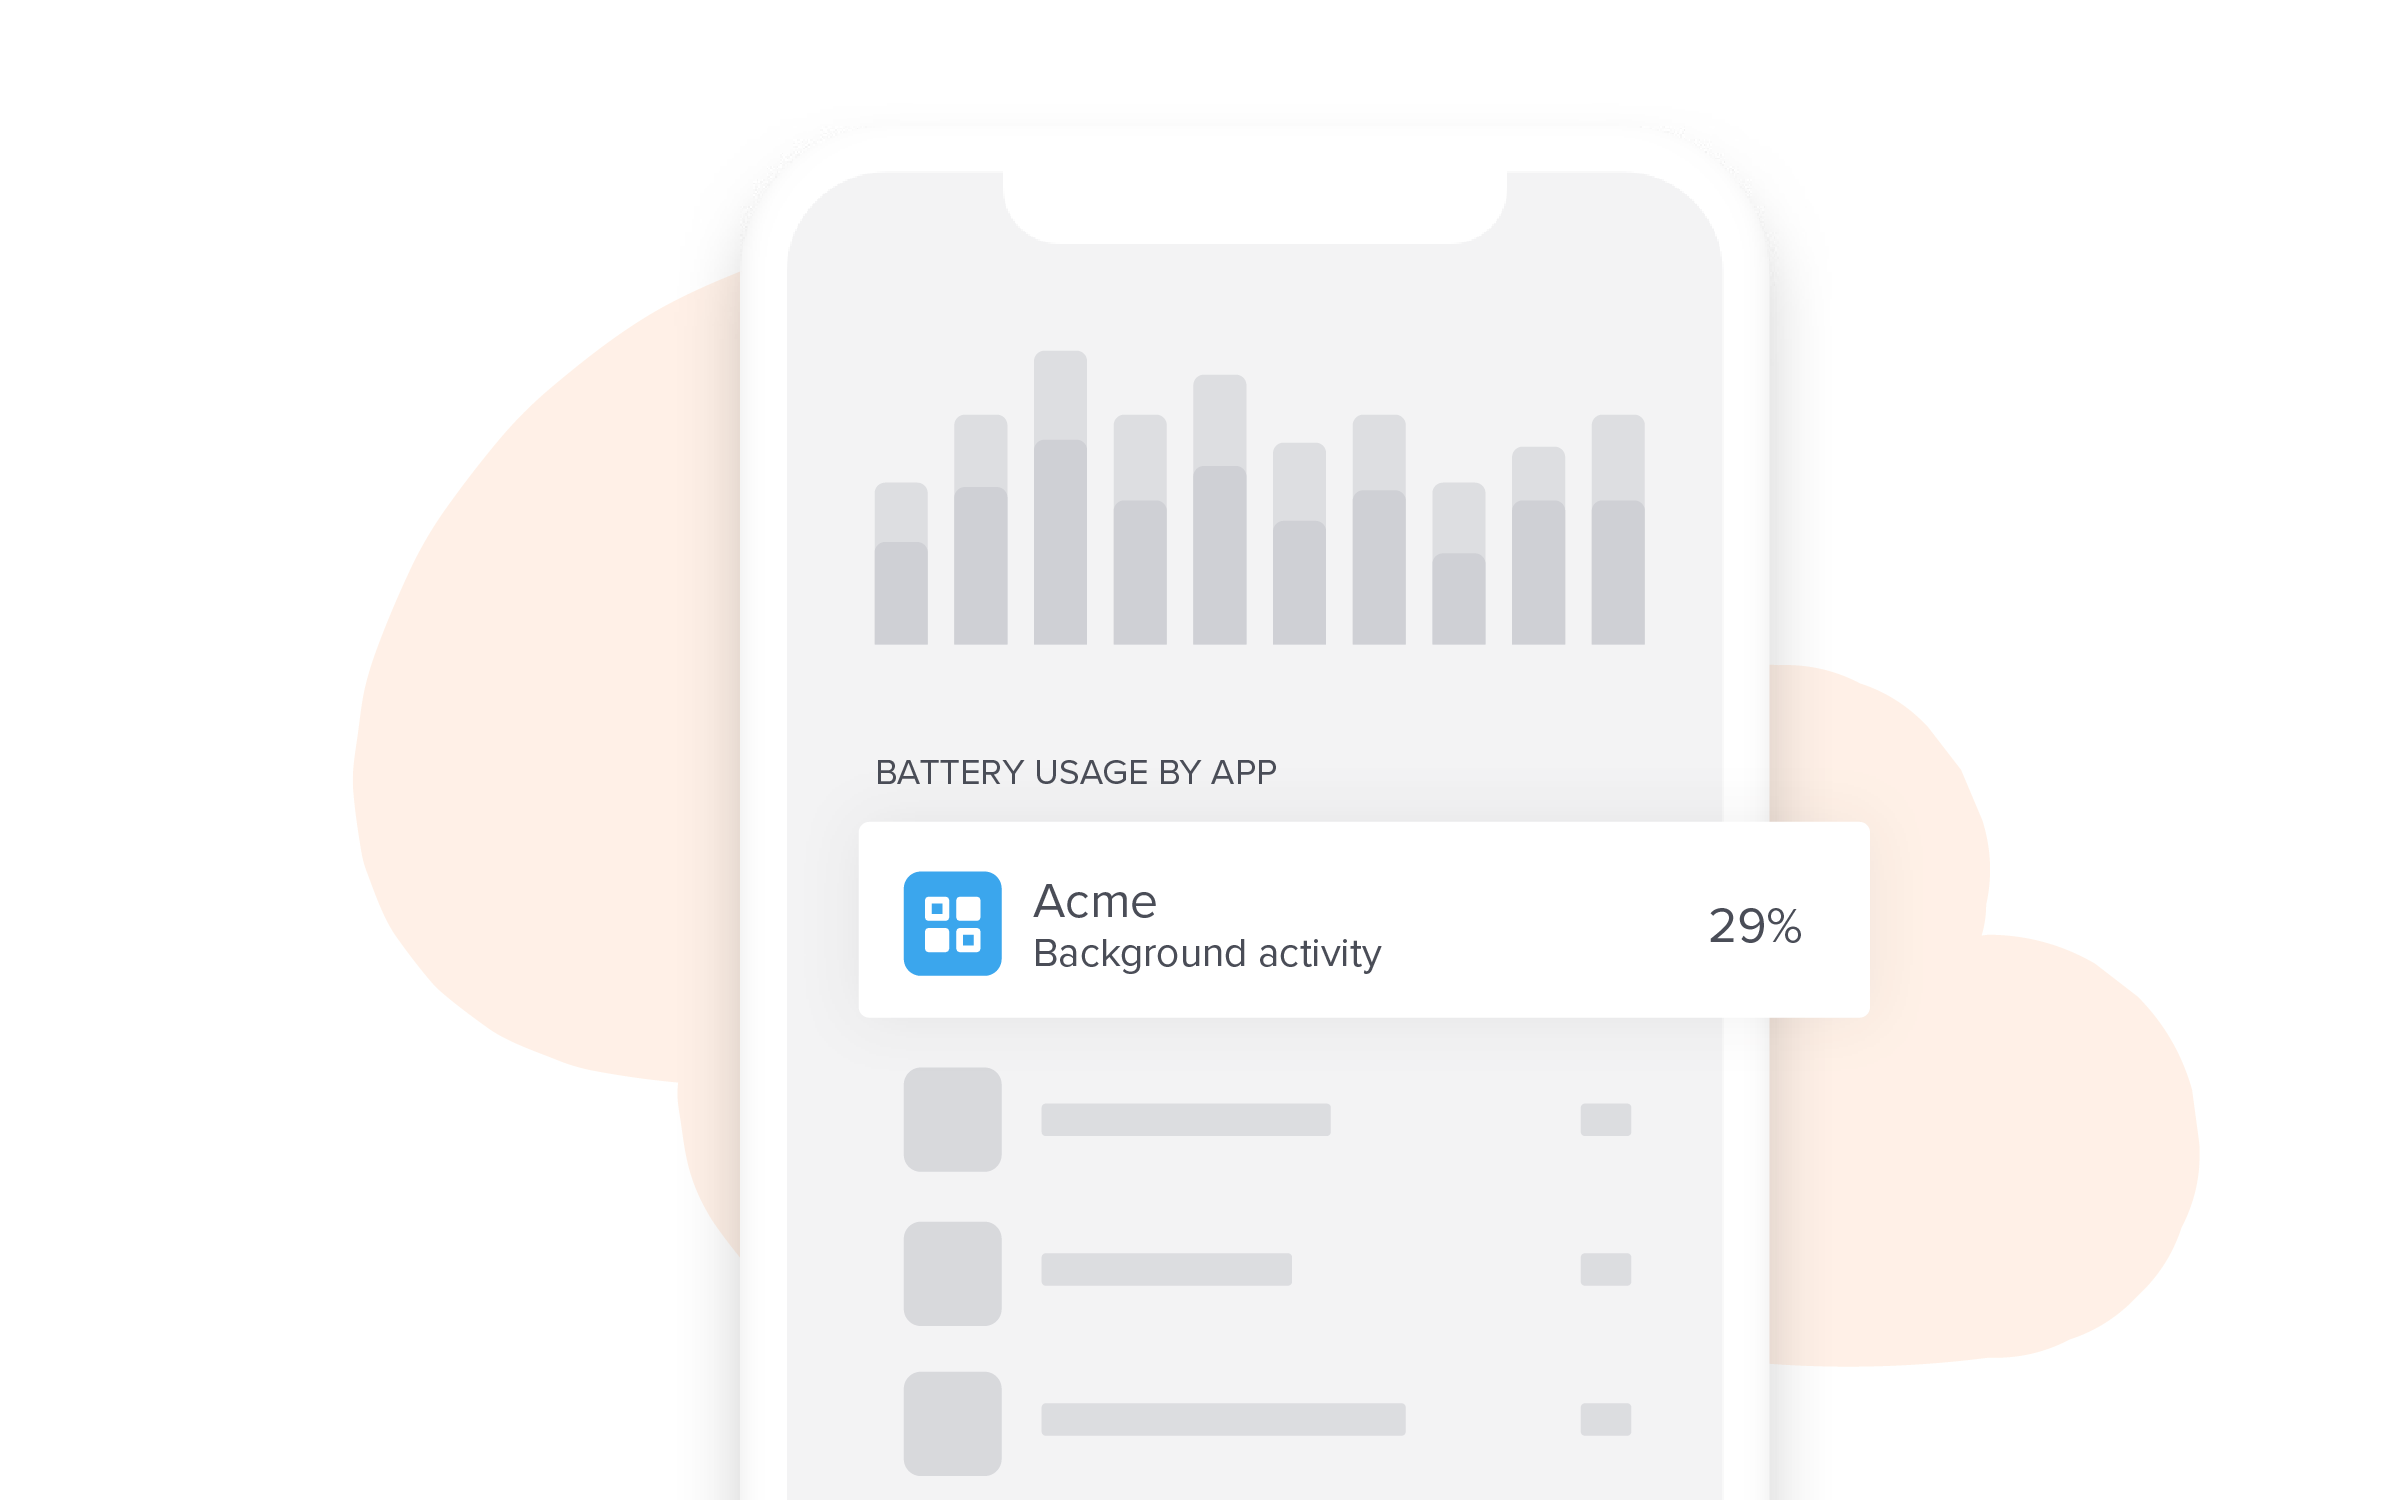
How much bandwidth and battery does your app consume?
It doesn’t get much worse than feeling reliant on an app that eats your battery for lunch and your data plan for dinner. With roughly half the U.S. population on capped data plans, it’s important to understand how your app factors into your users’ network consumption—and what you can do to lessen the load.
From the user’s side, there are settings that can be turned on or off to save battery power. But from a product experience perspective, it’s always a good idea to make sure your app isn’t the prime culprit.
The amount of battery life your app consumes is a critical component of your customers’ overall experience with your mobile product. In short, the easier your app is on their device, the more likely (and more frequently) your users are to use it.
The same is true with network consumption. Users are less likely to reach for apps that eat up their data—they’ll just find alternatives or workarounds. Knowing the impact your app has on your users’ data consumption can highlight some game-changing opportunities for your development team. That could mean decreasing your app’s footprint, building features that allow users to leverage low-data mode, or giving users more flexibility to configure their network preferences.
Why you should track battery and network consumption:
- Less consumption contributes to a better overall user experience
- Helps your app become more “sticky”
- Helps development teams optimize for users in low connectivity areas
- Adds context to other user sentiment data
4. Crashes, uninstalls, and active users
How many people are using your app (or breaking up with it)?
Knowing when your app crashes unexpectedly or when it’s uninstalled by your users can help your team pinpoint mission-critical problems and give you a sense of how valuable your users think your product is.
Crashes often point to technical issues or bugs in your app’s code, though they can have numerous root causes. Having visibility into the severity and frequency of these crashes (and a clear picture of which users are experiencing them) can help you get ahead of potentially large-scale issues or outages. It can also help you identify one-off vs. widespread crashes. This way, you’ll know if you need to take immediate remediatory action to prevent users from churning, or if you can pass off a single crash as simple user error.
As excited as all product leaders are to see how many users are actively utilizing their app, it’s also important to keep tabs on how many people are uninstalling it. Tracking uninstalls* can help you start a conversation with your users: What didn’t you like about the app? What wasn’t working well? What went wrong? Cross-referencing uninstalls with other behavioral data is also a great way to piece together the full story of your users’ experiences.
*There currently isn’t a way to track uninstalls on iOS devices—but you can on Android.
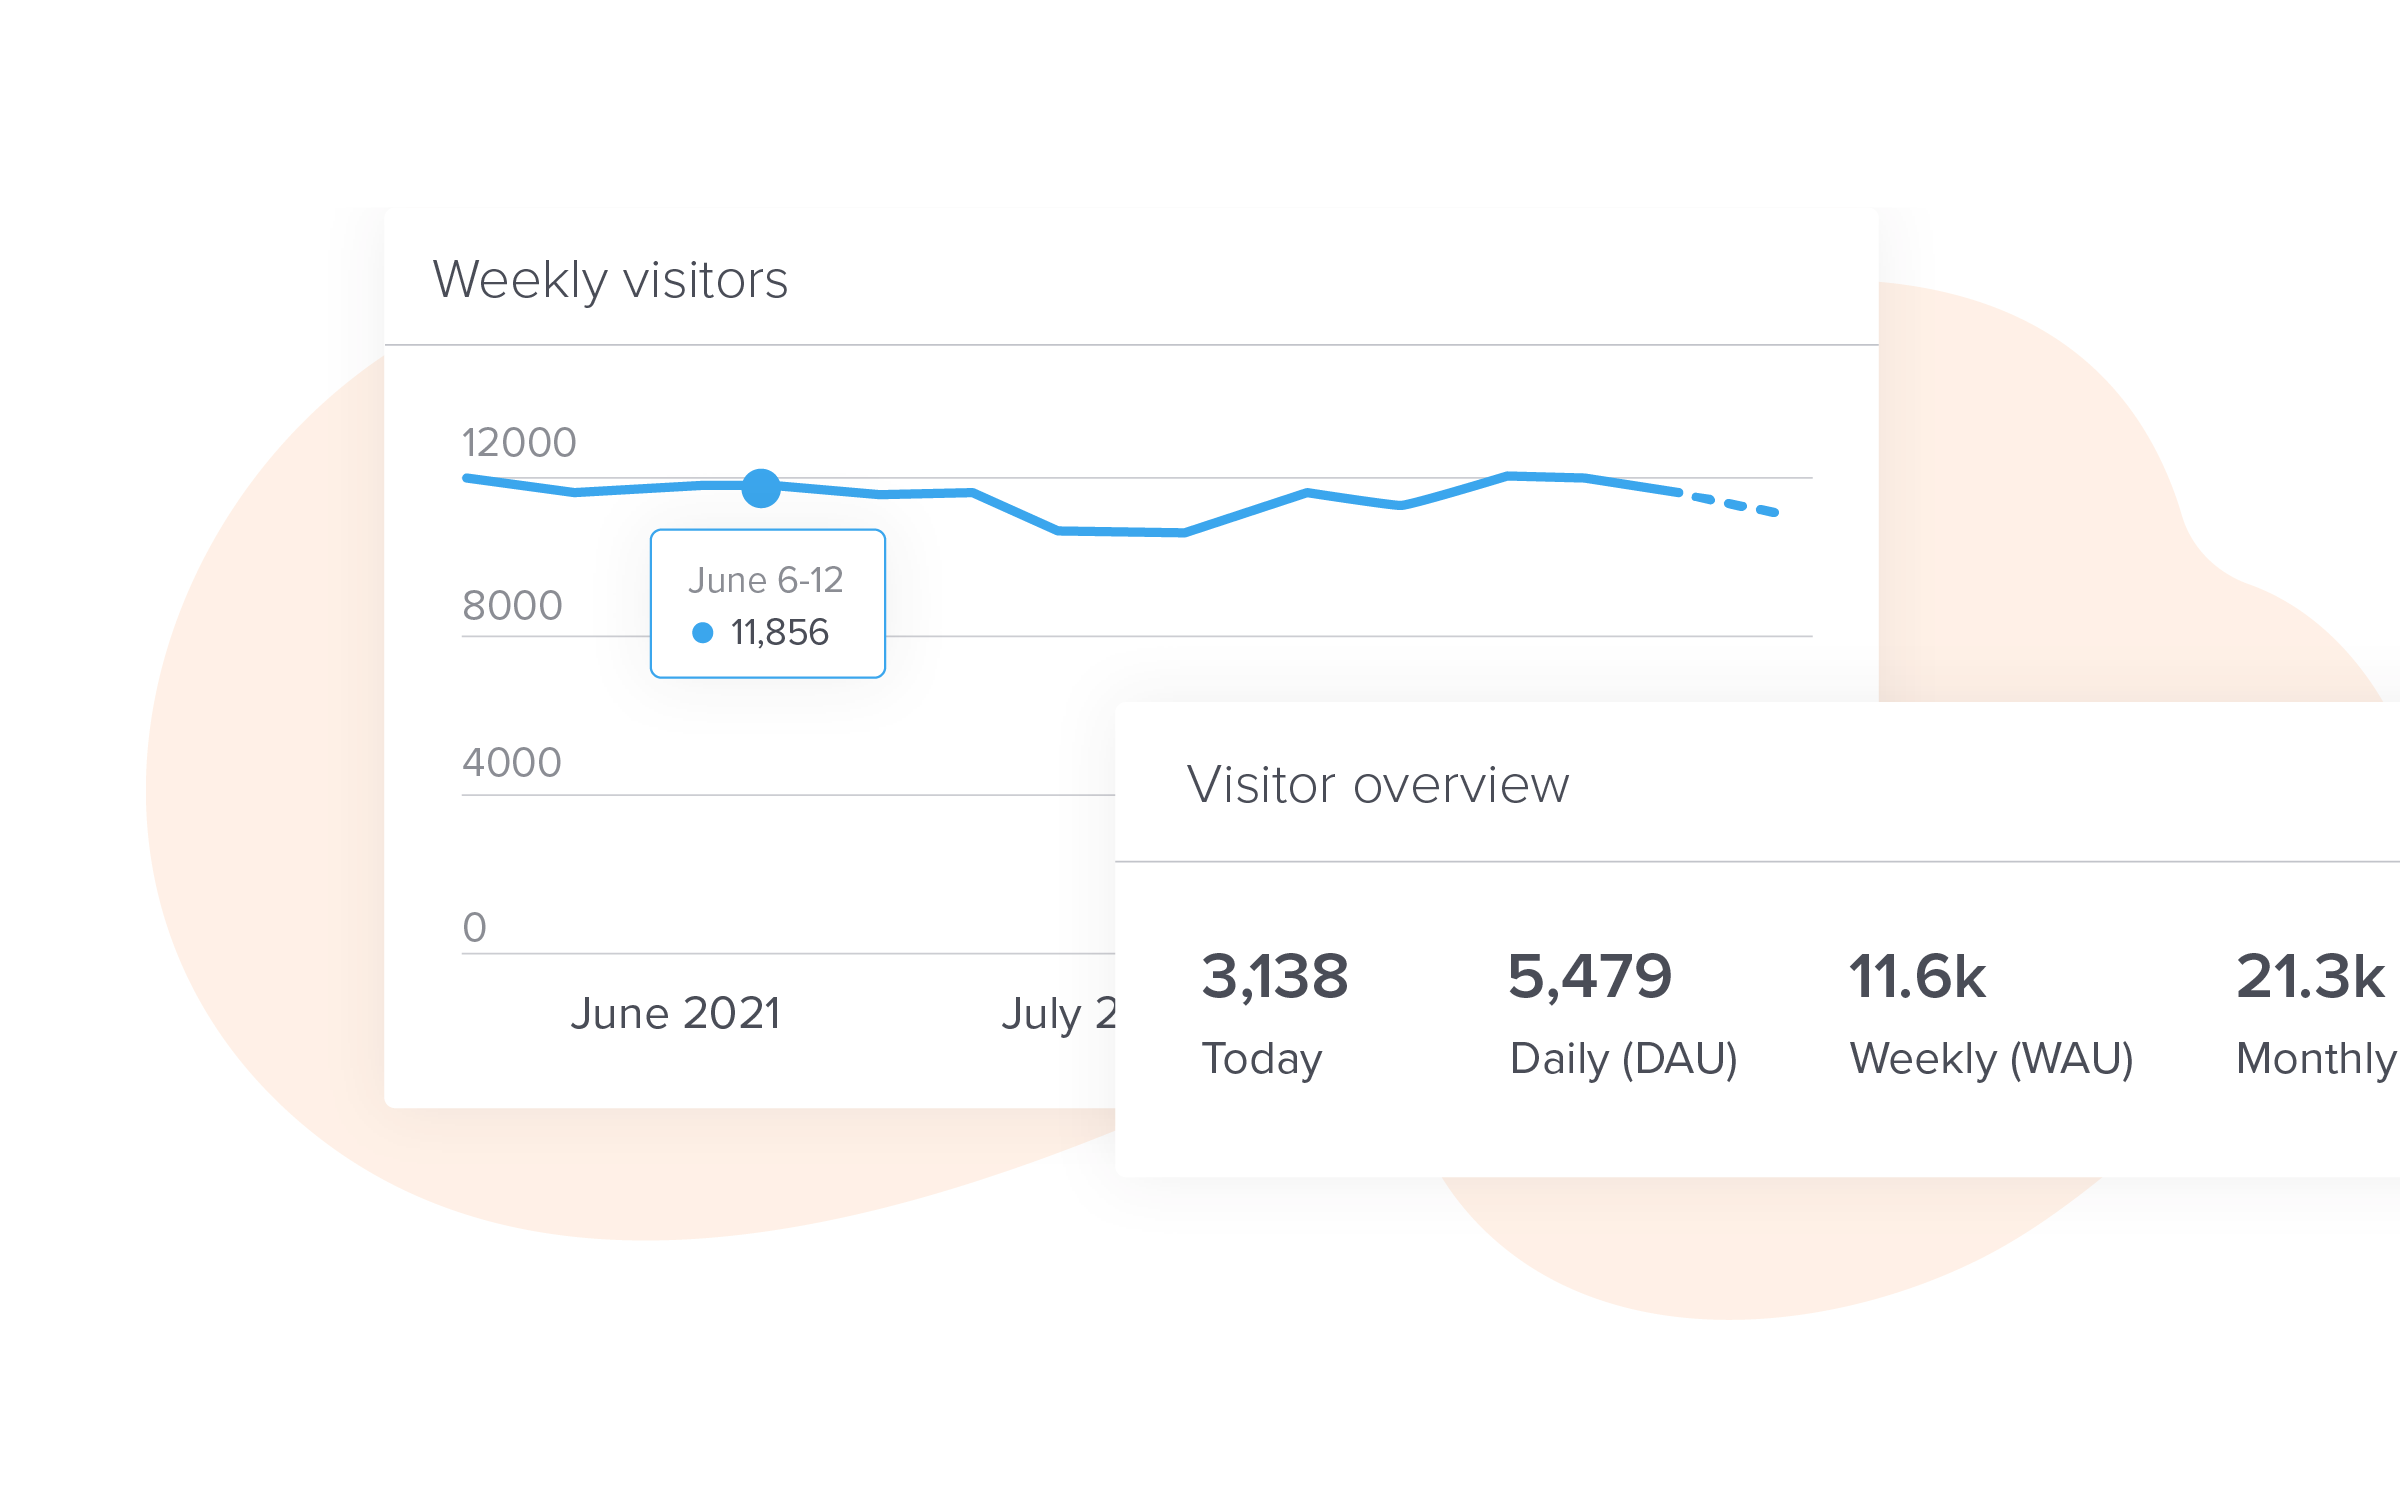
Daily Active User (DAU) and Monthly Active User (MAU) metrics tell you how many users visit your app on a daily or monthly basis, respectively. DAU measures the number of unique visitors that use your app each day (note that this metric tracks individuals, not sessions), while MAU tracks the number of unique users your app receives each month. DAU and MAU are both great measures of “stickiness” (more on that in the Product Engagement Score section), and help give you visibility into how valuable your users think your app is.
Why you should track crashes, uninstalls, and active users:
- Can serve as a “canary in the coal mine” for more widespread issues
- Helps product teams understand how valuable users find the app
- Good place to start when dissecting user frustrations
- Adds context to other user sentiment data
5. Feature adoption and Core Events
How are users engaging with your features?
Feature adoption is a critical metric that should be part of every mobile product leader’s arsenal. It’s a great indicator of how well your new features are received—and if they’re being incorporated into your users’ everyday workflows.
Use analytics tools to see how your users engaged with your mobile features following previous releases, and note feature adoption drop-off in the weeks and months following the initial launch. Also be sure to assess the percentage of users and customers that initially adopted those new features, compared to how many still use them today—this will give you great insight into how useful your users think your features really are.
If possible, be sure to measure feature adoption at both the user and account level. This will help you create more targeted adoption campaigns (if necessary) and give you insight into how relevant various features might be to specific user groups or personas.
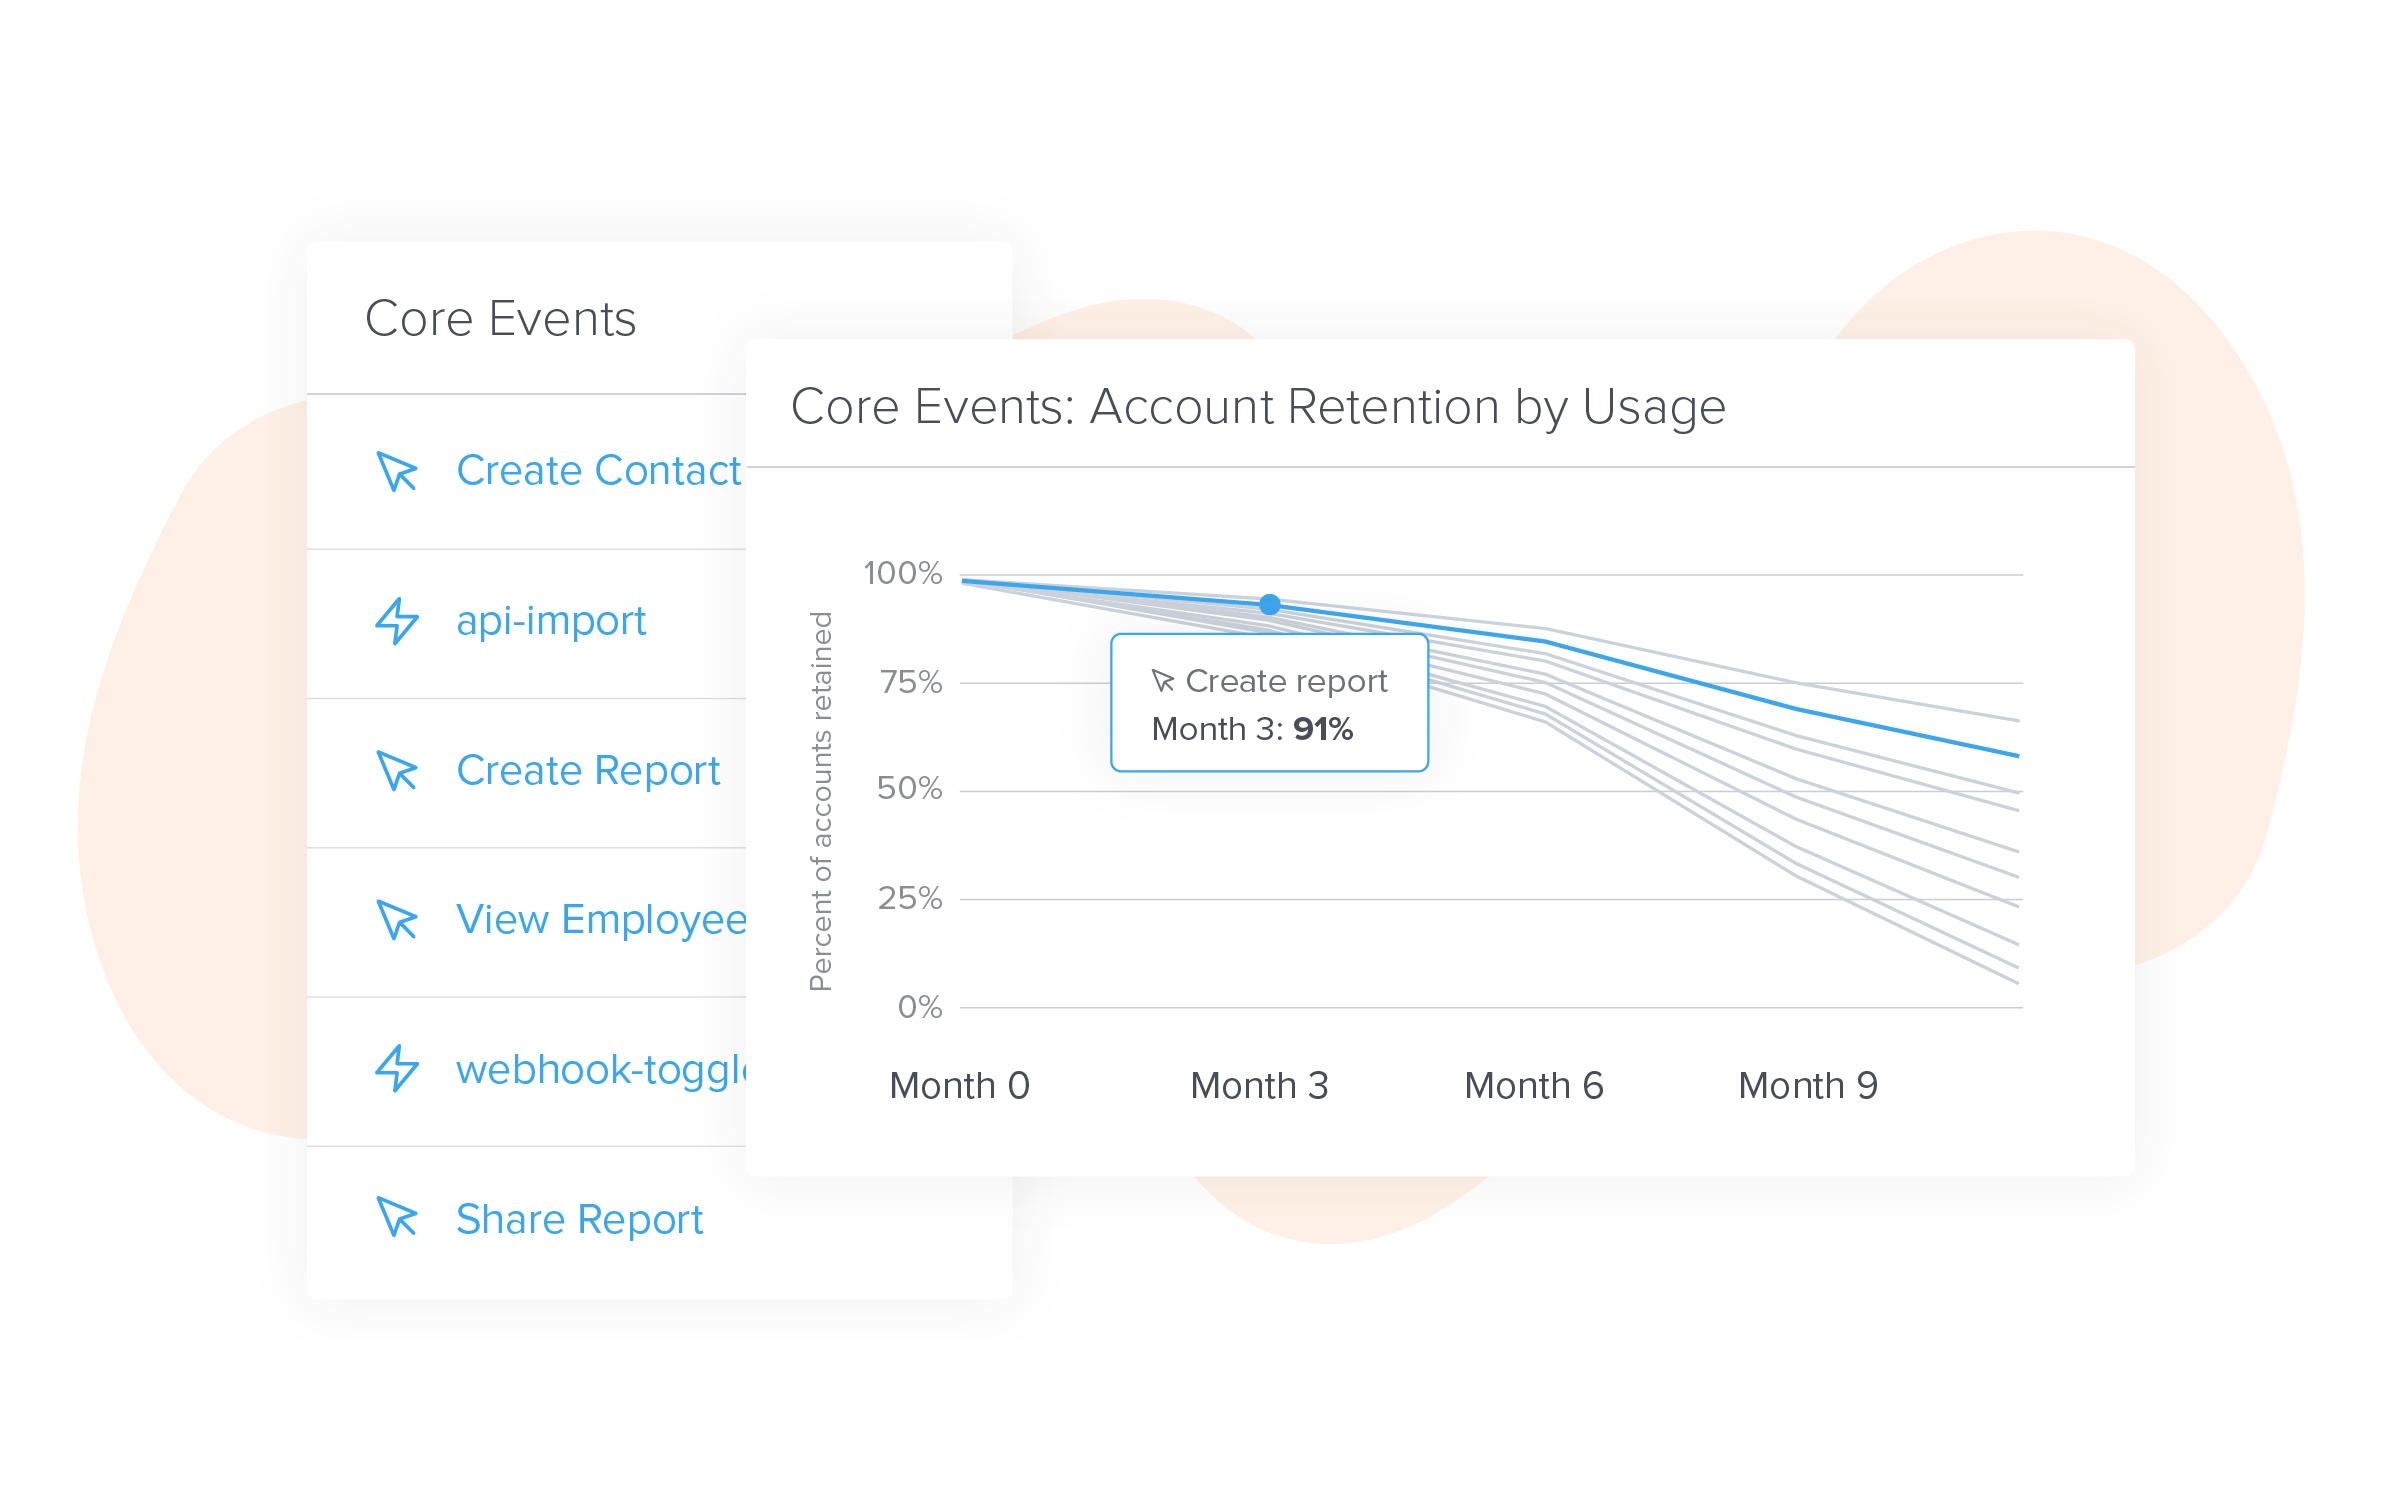
Core Events are another utilization metric that can help you understand how users are engaging with your app. A Core Event is some kind of “terminal action” that indicates that the user has completed a workflow or achieved a valuable outcome. For example, completing a transaction, publishing a report, or creating a contact. With a tool like Pendo, you choose your own Core Events based on your product and the user actions that mean the most to your business.
Once you’ve identified your Core Events, you can dig in further to understand key user behaviors—including how long it took for your users to discover or use a feature, how the experience varies for users on particular device types or operating systems, and which features get the most use on mobile. These kinds of data points are invaluable for shaping your roadmap and determining how to make the most important processes within your app even simpler for your users.
Why you should track feature adoption and Core Events:
- Allows you to see how effective your launch campaigns were
- Helps you understand which features your users find most valuable
- Leads to better user segmentation and more targeted messaging
- Helps product teams identify feature gaps
6. App store ratings
How popular is your mobile product?
While app store ratings may feel like vanity metrics, they’re actually incredibly important for mobile success.
It’s common knowledge that users are more likely to download (and use) apps with high app store ratings. For each star docked off a rating, prospective users become less and less likely to consider using your app. For business productivity use cases, that means employees might ignore their IT team’s guidance to use your app (or worse yet, they’ll find workarounds). And for consumer-facing apps, that means your potential users will seek alternatives elsewhere.
For the same reason we rely on reviews before making a significant purchase or booking a dinner reservation, we rely on app store ratings to reassure us that we’re making a good—and ultimately valuable—decision. We trust the experiences of our fellow users more than marketing pitches. So while ratings can feel like a popularity contest, they have serious implications for your app’s reputation.
Your rating also impacts how visible your app is in mobile app stores. Higher rated apps rank higher in search results, while lower rated apps are pushed to the bottom of the list. This is particularly crucial in the mobile world because people inherently don’t like to scroll. We process information in the order we receive it. And, especially when we’re in a hurry, we’re more likely to take what’s served to us first rather than poring through pages of search results. Always shoot for page one!
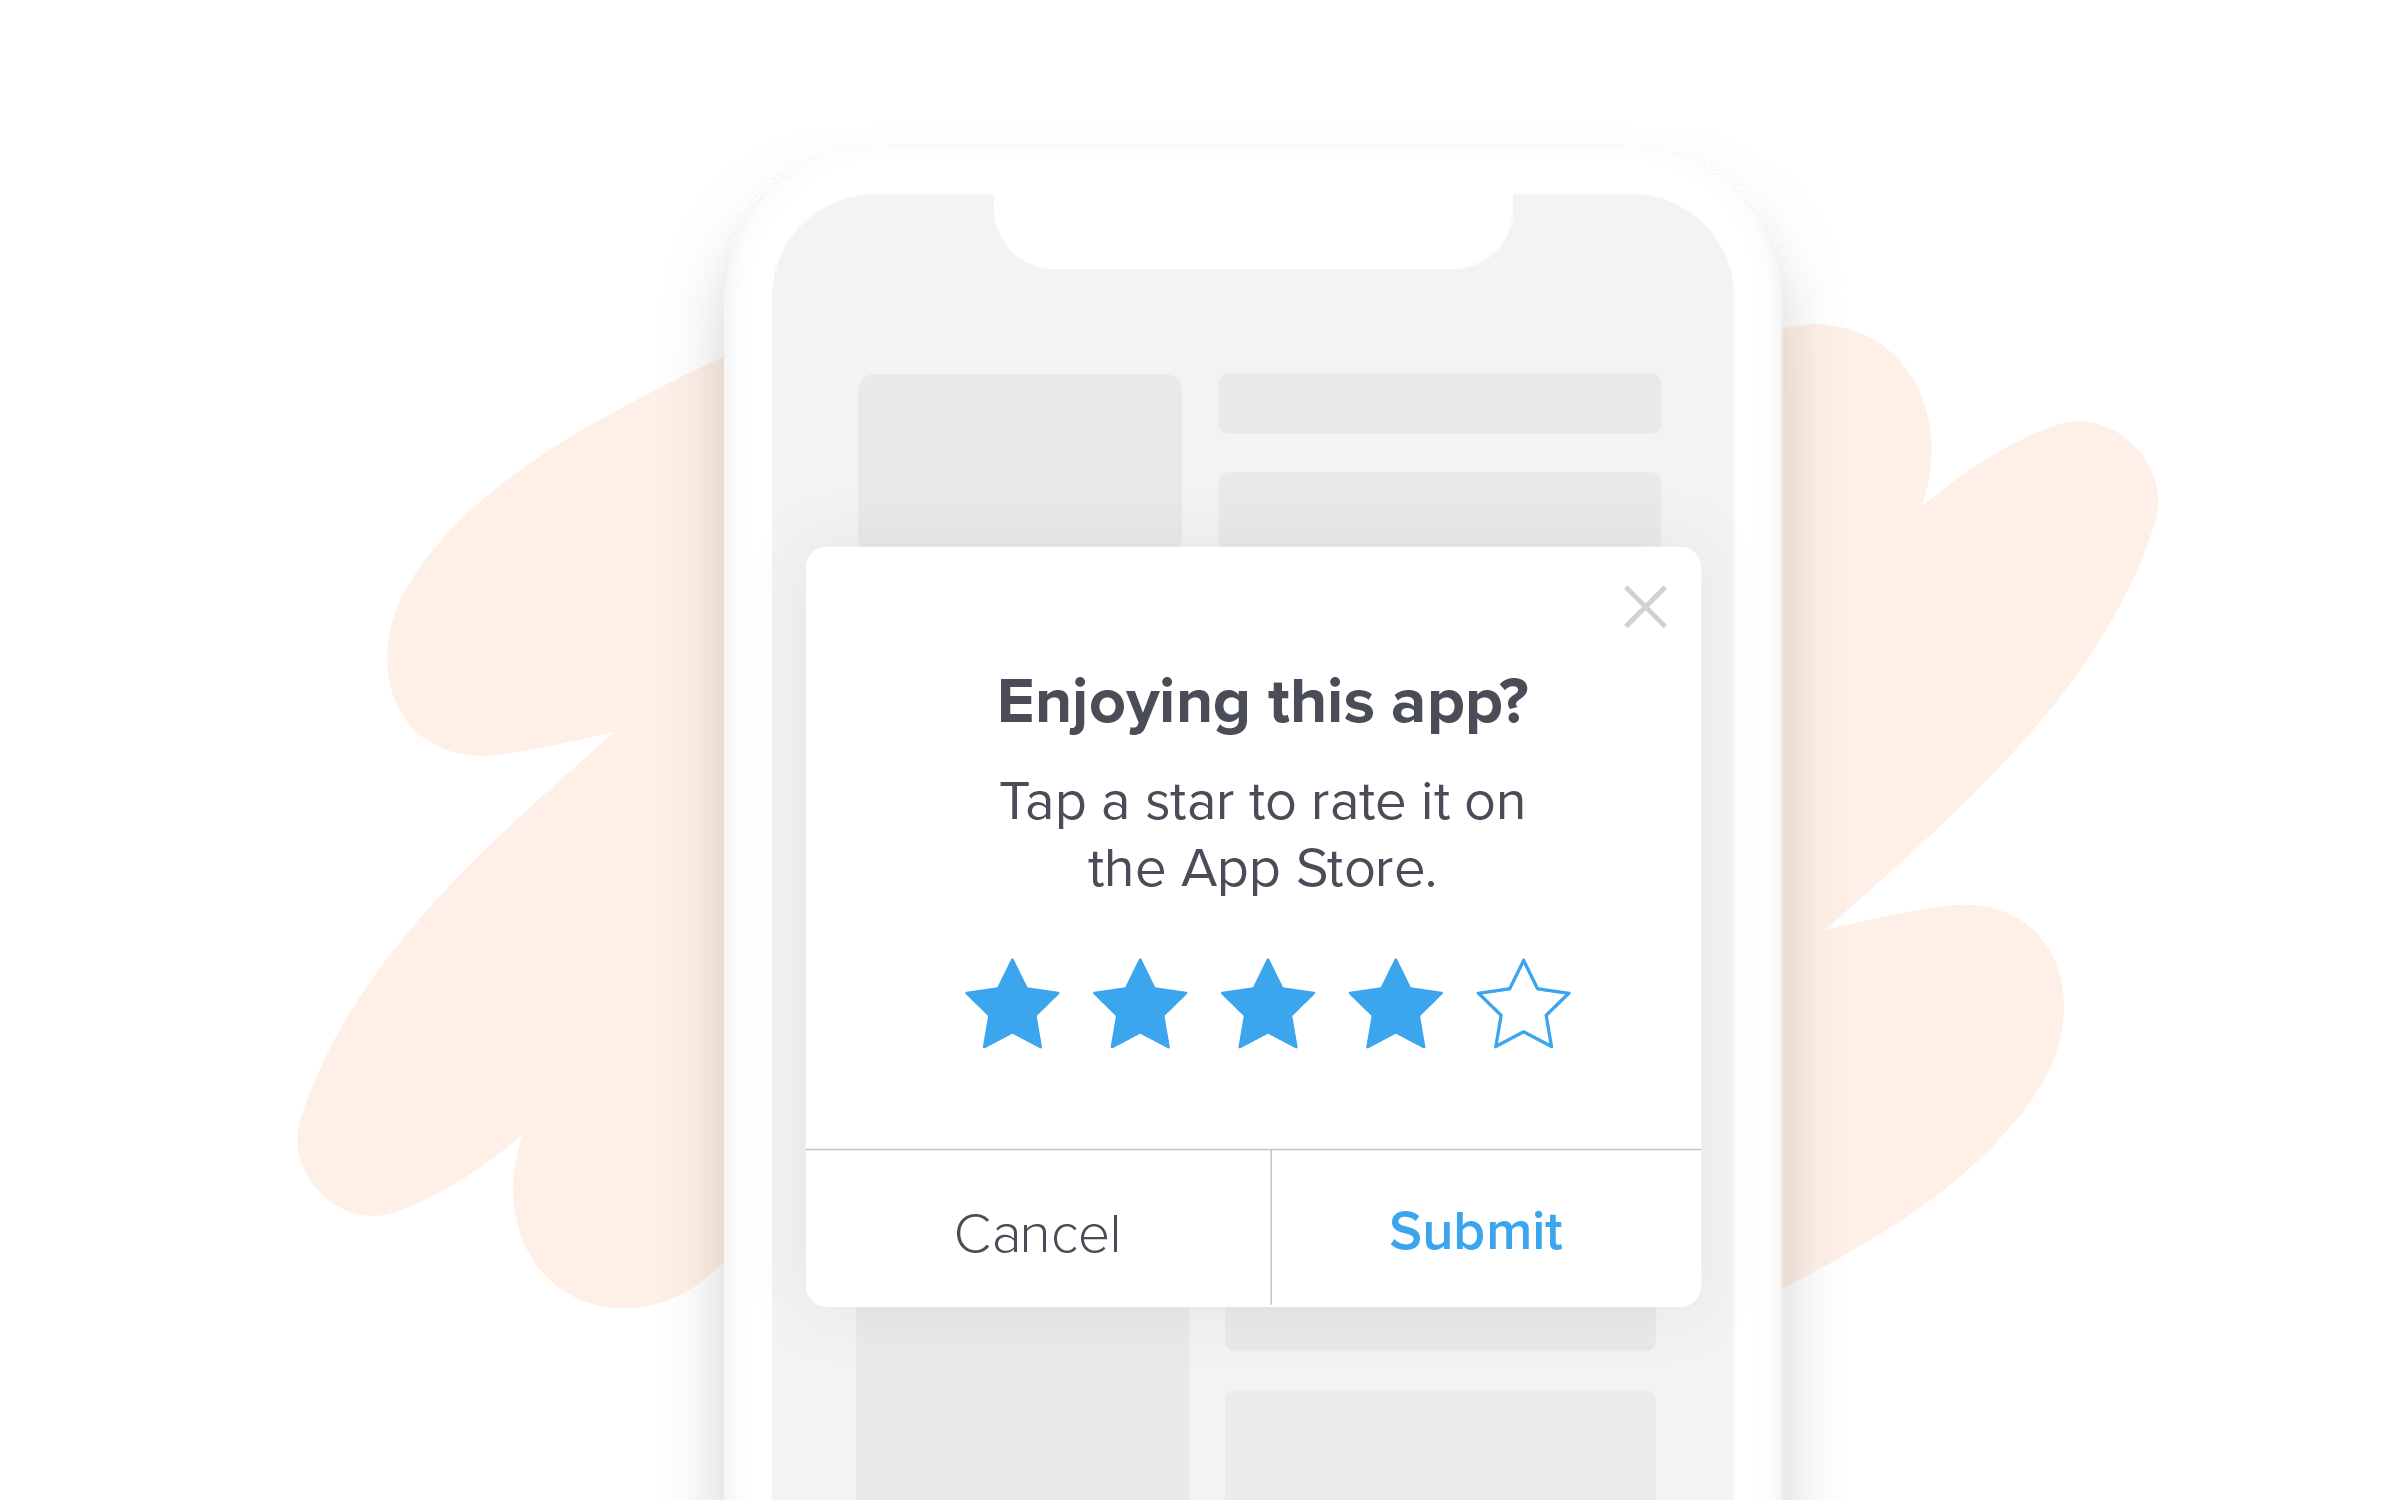
In-app messaging is particularly helpful for asking your users to rate your product (just make sure to catch your users in a moment of delight!). You’ve likely seen these rating prompts before: “How are you enjoying [app name]?”, plus the option to select a 1-to-5-star rating. Not only does this data capture fuel your ranking in the app store, it also helps your team validate which aspects of your app are most exciting or useful to your users. Tracking your app store ratings over time, particularly as you release new and improved versions of your app, can be a great way to understand what your users love—or don’t love—about each new iteration of your product.
Why you should track app store ratings:
- Improves the likelihood that prospective users will download your app
- Good indicator of user sentiment and happiness
- Gives you a benchmark to measure against competitors
- Helps improve your app’s discoverability and ranking in the app store
7. Retention rate
How many of your users are in it for the long-haul?
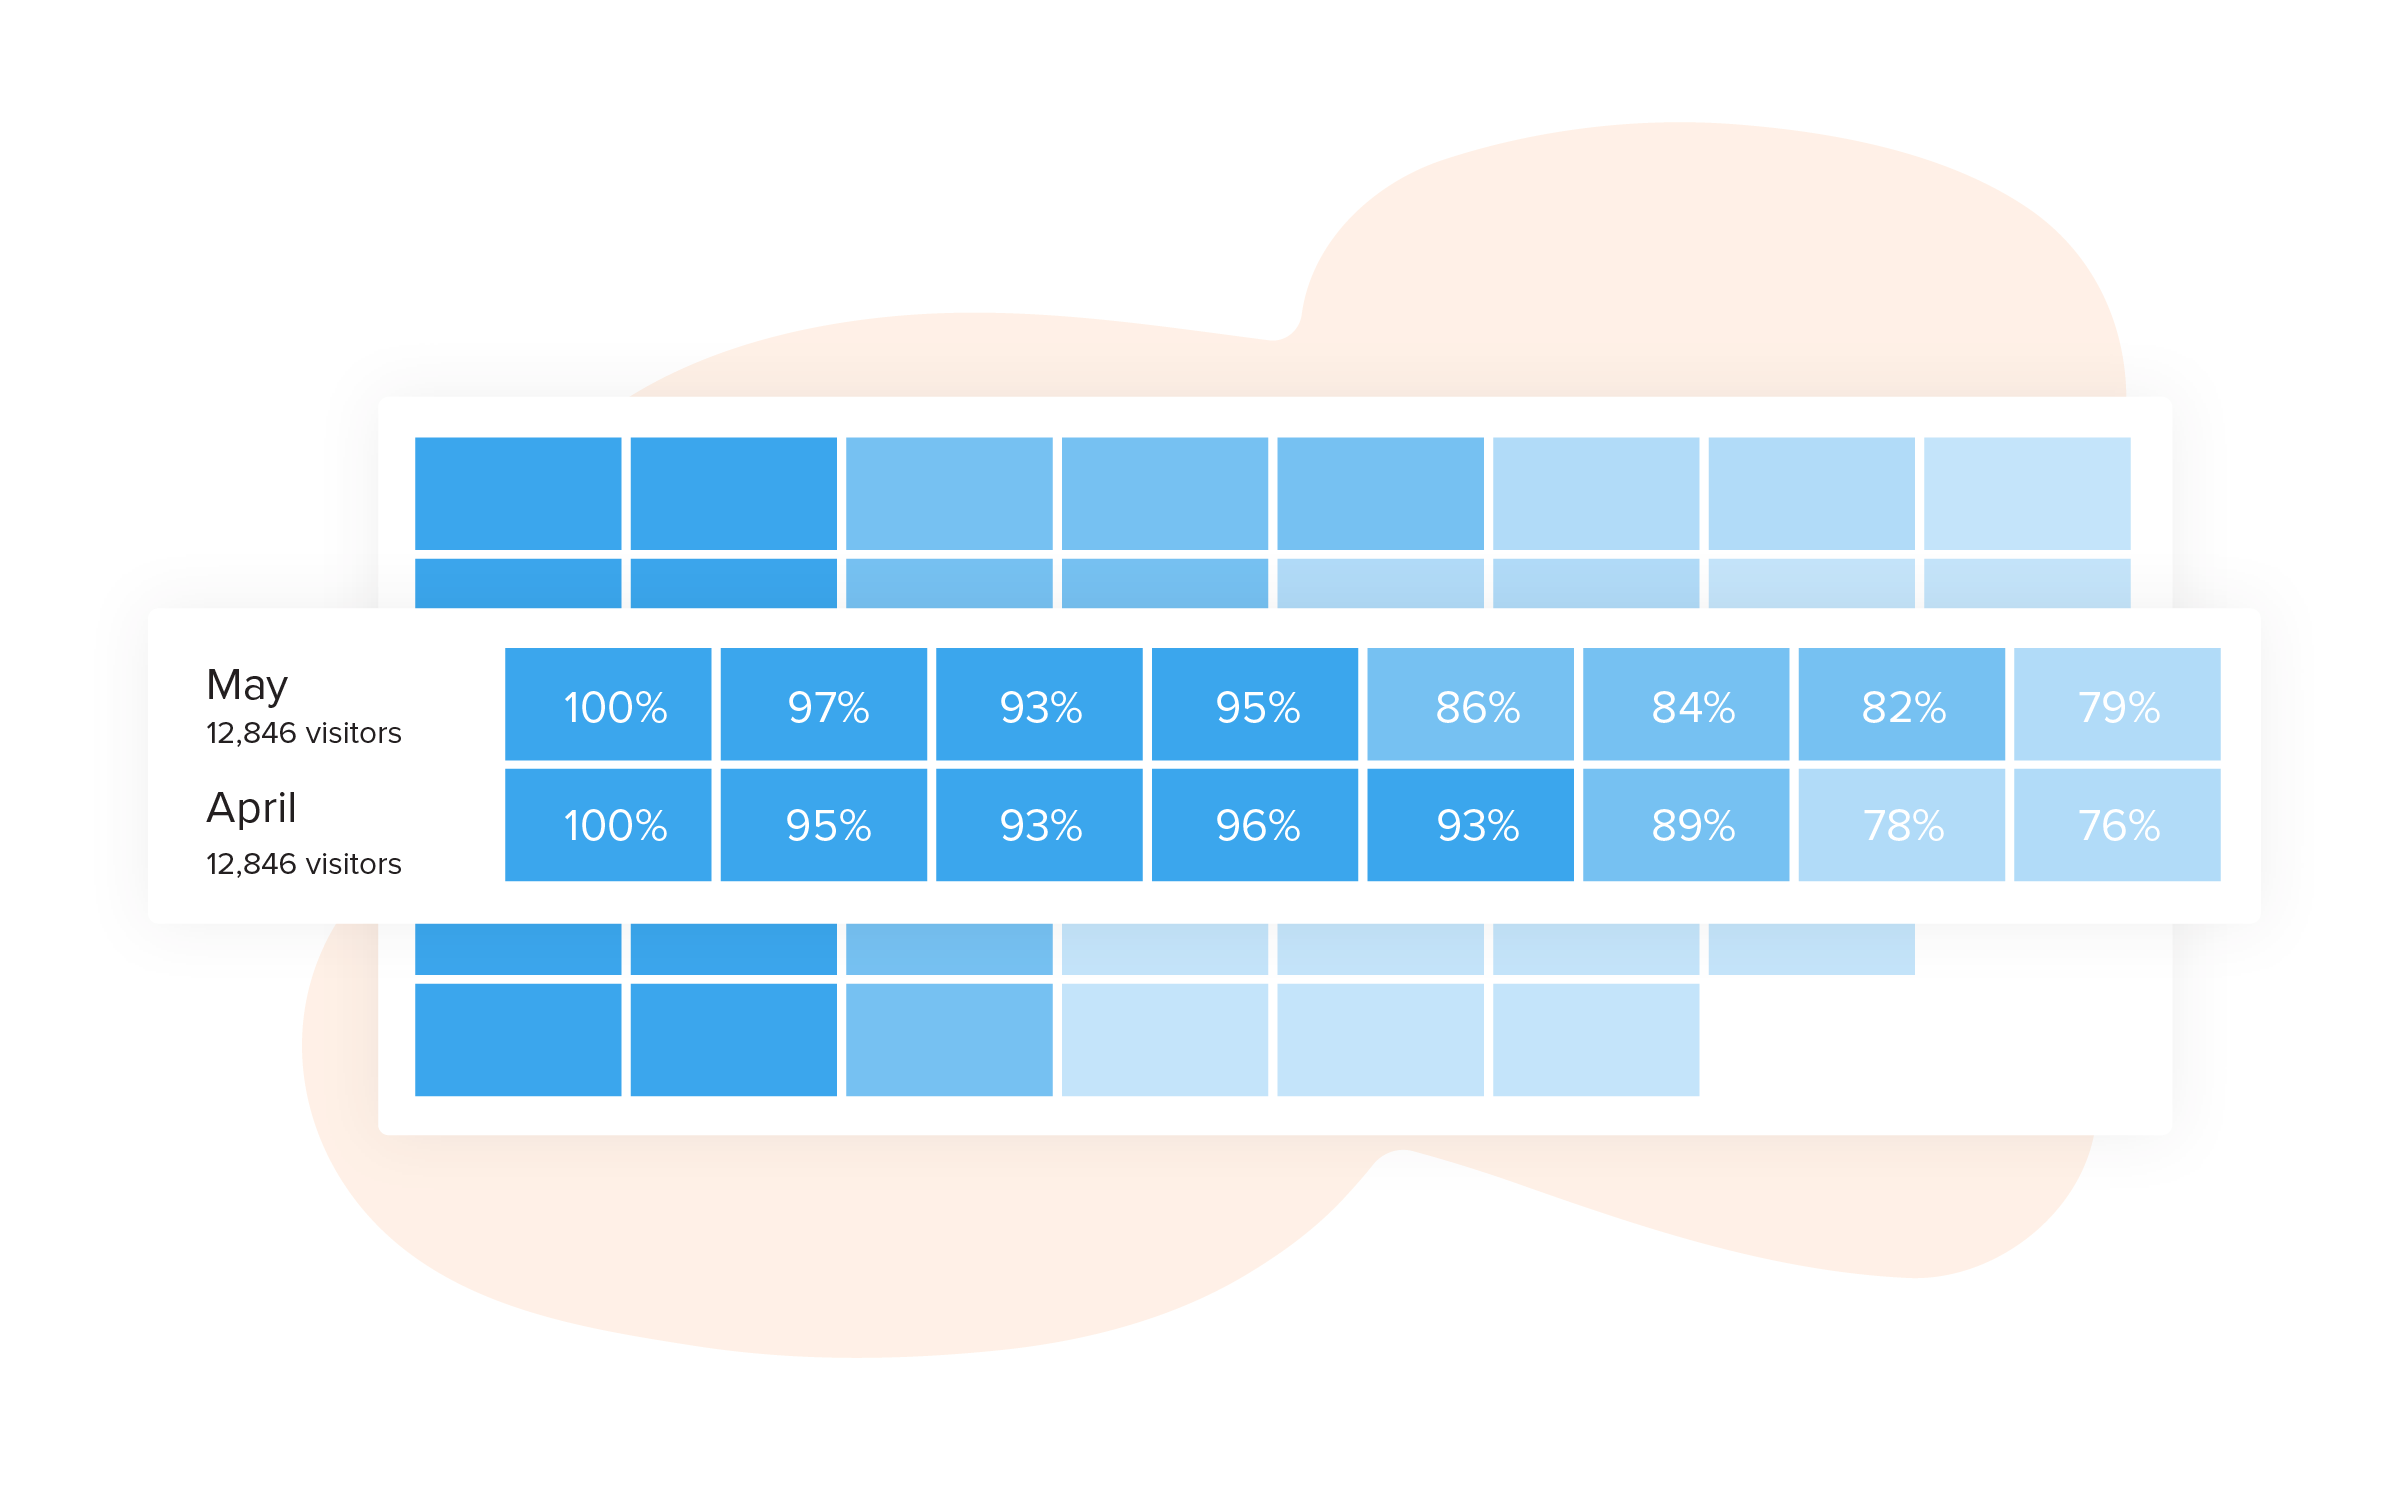
Retention rate is the percentage of users still using your app after they initially install or start using it. It’s typically measured at various time intervals, like Day 1, Day 7, Day 30, and beyond.
Low retention rates could point to any number of issues within your app, so it’s important to look at all your user data to get the full picture. Your users could be struggling with the onboarding experience. Your app could be crashing frequently. Or maybe your users don’t understand your app’s value. Investigating what’s going on behind that low retention rate will help you get to the root cause and find a fix before it’s too late.
There isn’t a scientific formula for dramatically improving retention rates—and retention benchmarks vary broadly between industries. But there are a few simple steps you can take to improve your users’ overall experience (and their likelihood to stick) with your app.
Optimize the in-app onboarding experience:
Make it easy for your users to start and keep using your app. Guide them through the key activities and features they’ll use most frequently, based on their specific role. And help them understand the value of using your app—what’s in it for them?
Leverage in-app messaging:
Use guides, tooltips, and lightboxes to help your users navigate your app—as opposed to forcing them to leave your product and head to an external “help” page when they get stuck. This kind of in-app communication can also help alert your users about new features, updates, or other important announcements you want them to see.
Make sure they’re using your latest version:
As we covered earlier, users often experience unnecessary frustration with mobile apps simply because they aren’t using the latest release. This negative sentiment can ultimately impact how likely a user is to churn.
Ask for their feedback:
Check in with your users to see how things are going. It helps give your team inspiration for future releases, makes your users feel welcome and valued, and fosters loyalty.
Why you should track retention rate:
- Helps uncover potential issues with your app early on
- Good indicator of user sentiment, happiness, and perceived value
- Impacts app store ranking and discoverability
- Directly correlates to competitive advantage
8. Product Engagement Score (PES)
What’s the overall health of your mobile product?
Building on feature adoption, Product Engagement Score (PES) is a metric that provides a singular view into how your users are interacting with your product. It’s a composite score, made up of three elements:
- Adoption: The percentage of users or accounts using key features in your product, represented by any or all of your Core Events
- Stickiness: The 30-day rolling average of the percentage of monthly active users who return to your app either daily (DAU ÷ MAU) or weekly (WAU ÷ MAU)
- Growth: User or account growth rate for the chosen time period, compounded to the annual growth rate
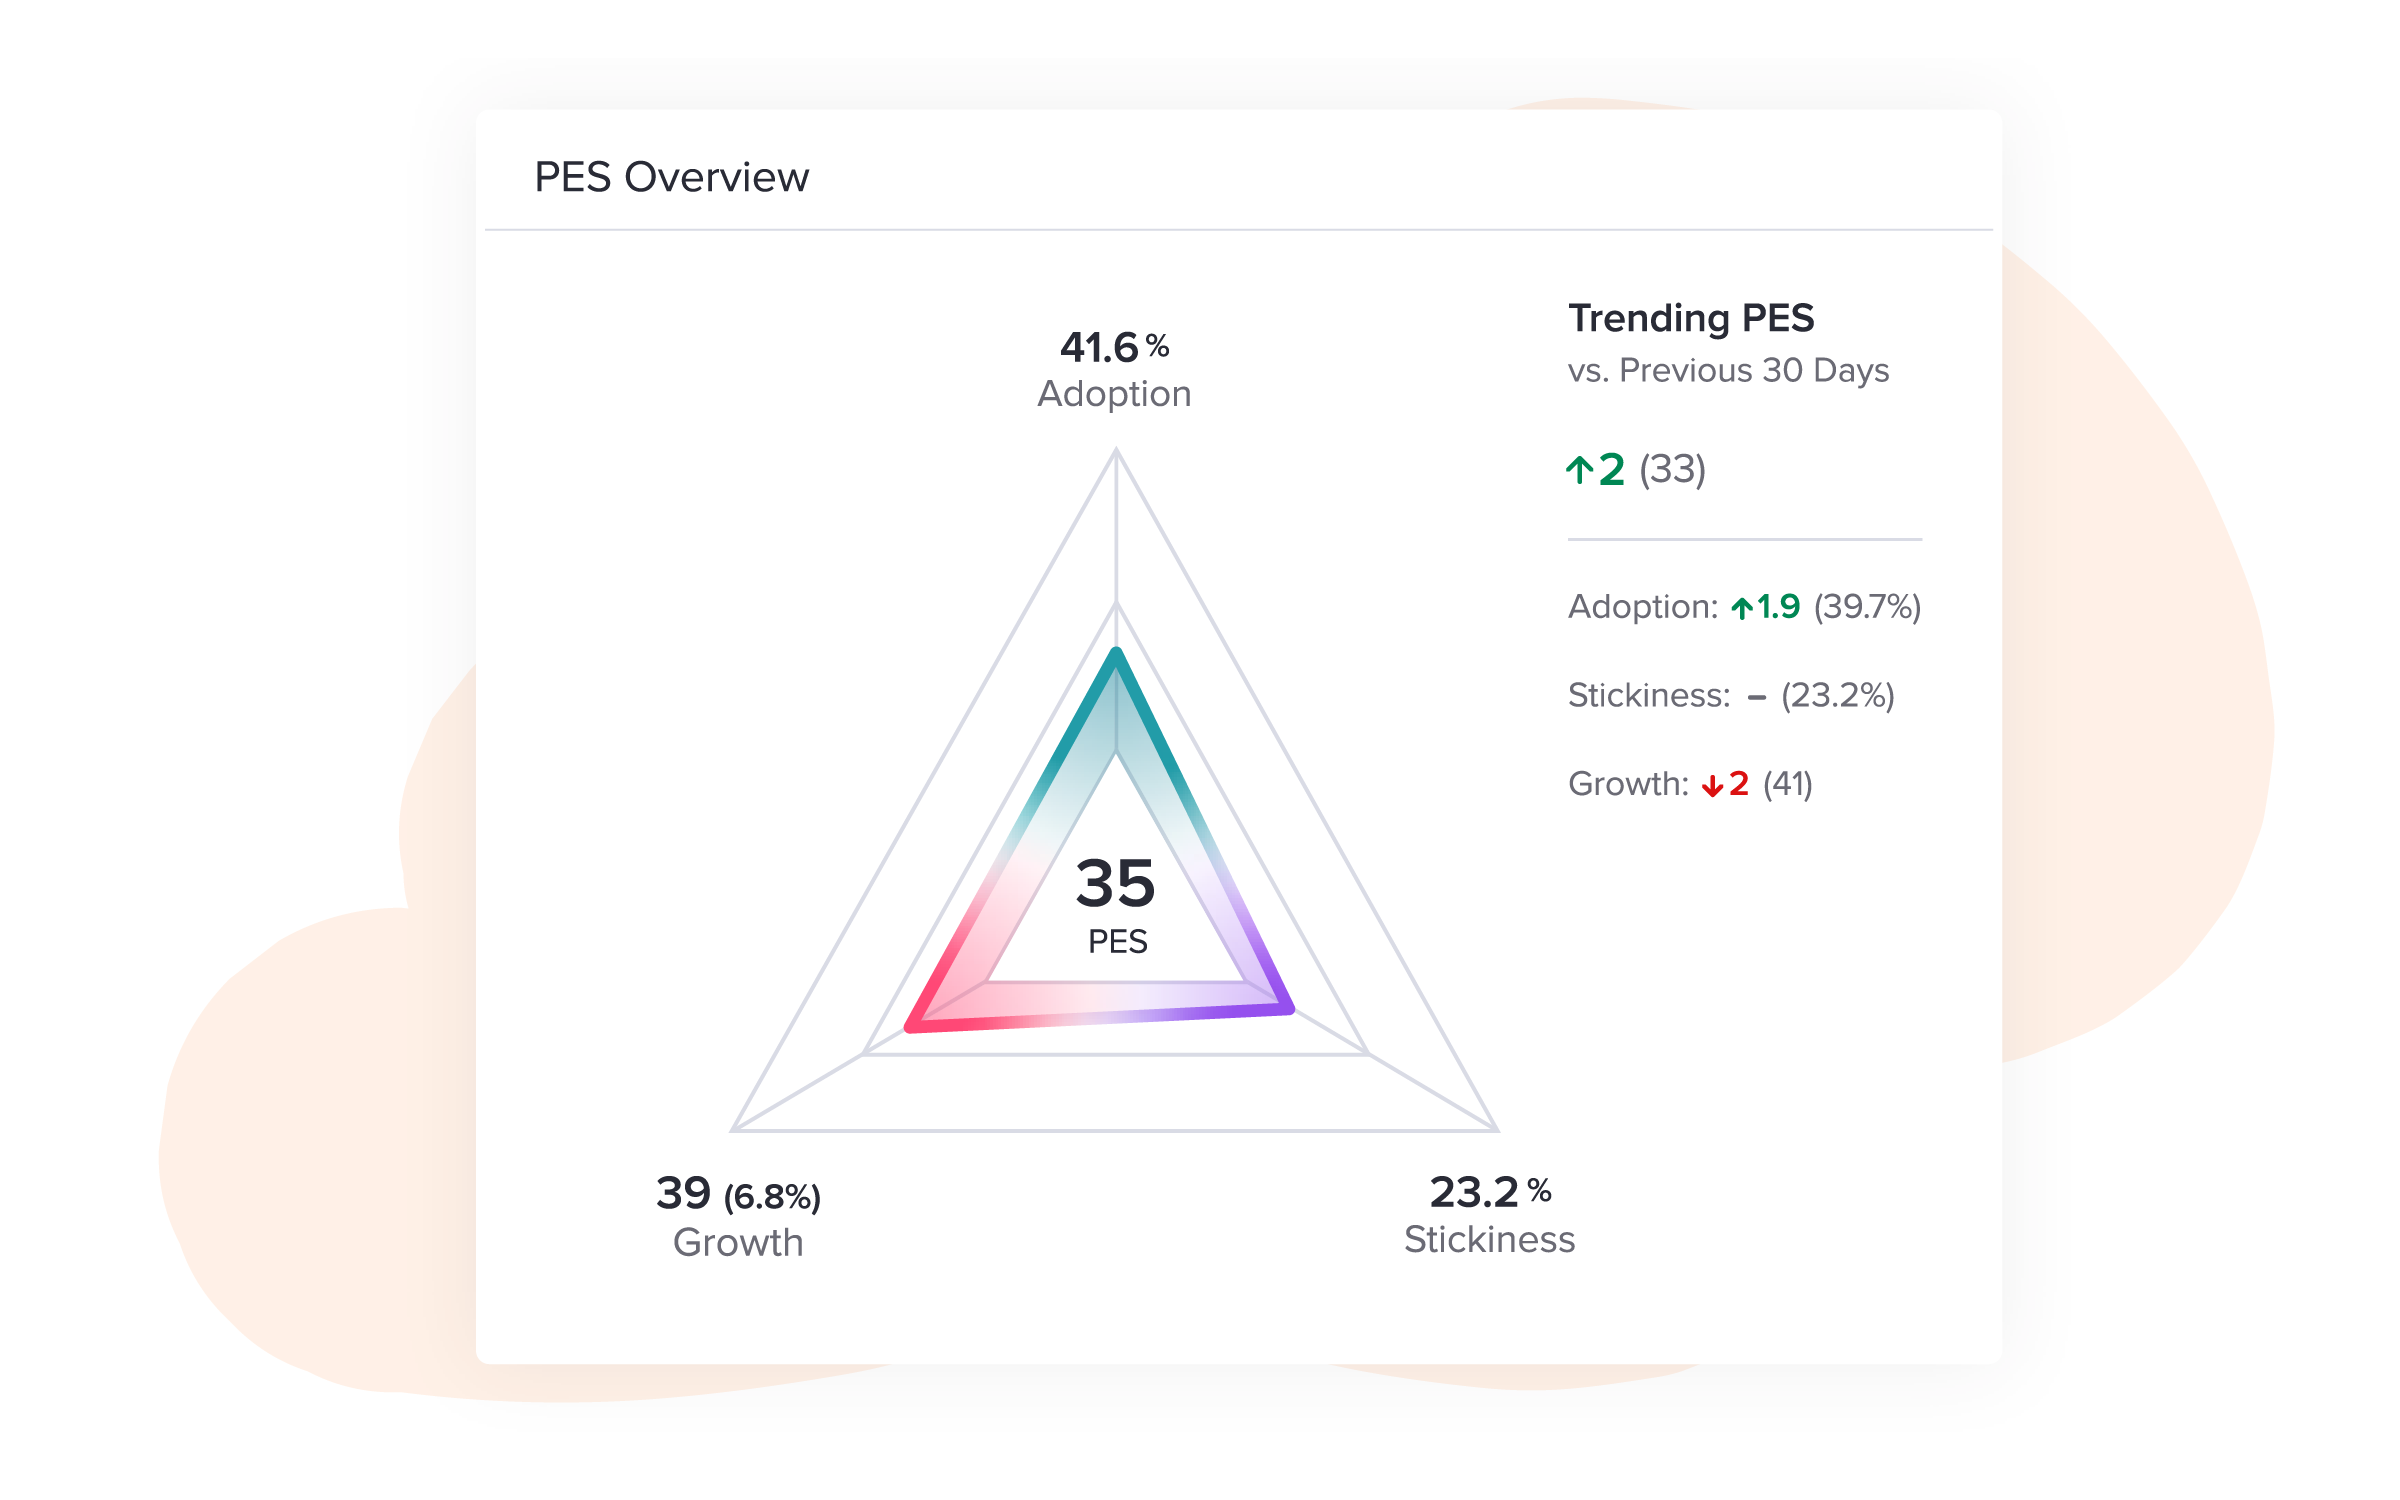
Once you’ve calculated adoption, stickiness, and growth using the parameters above, calculating PES is simple. Just take the average of those three numbers, expressed mathematically as: (Adoption + Stickiness + Growth) ÷ 3.
PES is an effective way to track your mobile product’s progress over time, in the three key areas most critical to a product’s success. PES is also a great starting point for digging deeper into the “why” behind each individual element. And combined with customer feedback, PES is an ideal metric to regularly report on to your leadership team—providing a balance of performance and sentiment data.
Why you should track PES:
- Comprehensive composite metric to monitor regularly and report on over time
- Reflects real user behaviors inside your app
- Aggregate score that allows you to dig into each element as needed
- Objective, quantitative complement to qualitative customer feedback
9. Net Promoter Score (NPS)
How likely are your users to recommend your app?
Net Promoter Score (NPS) is one of the most popular and widely accepted ways companies measure customer loyalty and happiness.
NPS data is typically captured through a simple question: “How likely are you to recommend [Company name] to a friend or colleague?” The respondent is asked to provide a score from 0 to 10, and ideally is also given room to explain why they chose that score. From there, calculating the company’s NPS is relatively simple.
- 9s or 10s are your Promoters
- 7s or 8s are your Passives
- 0s through 6s are your Detractors
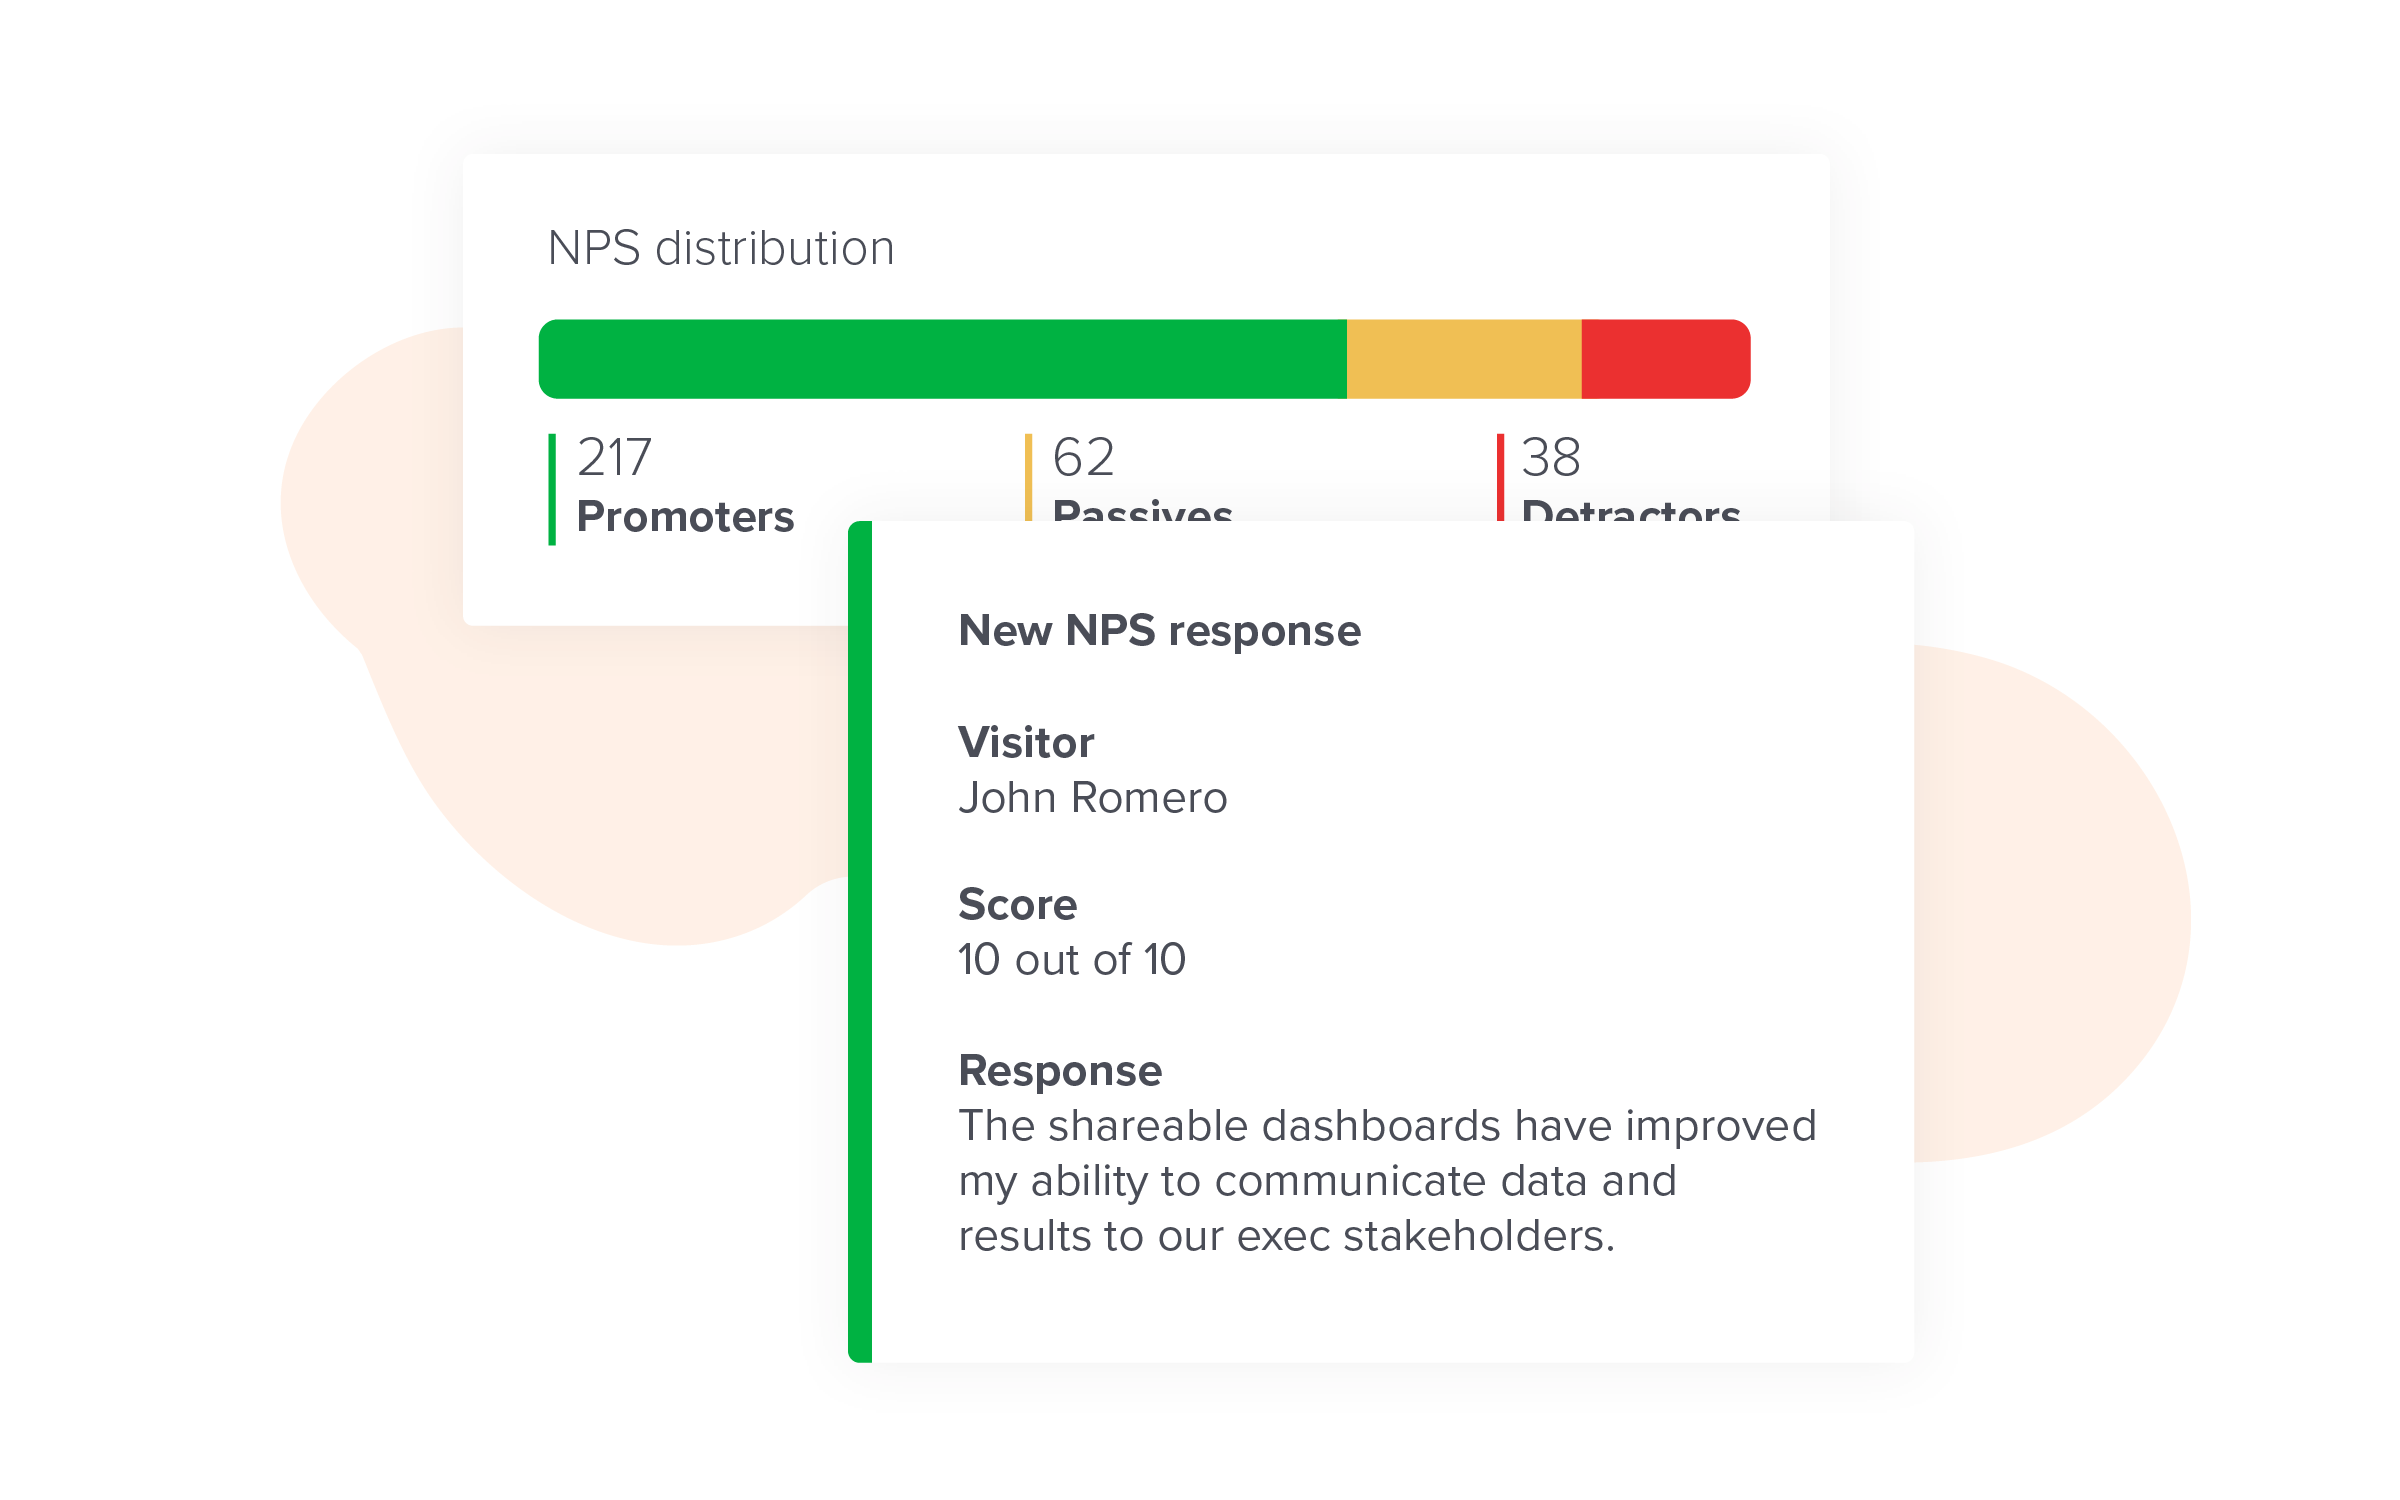
To calculate NPS, disregard any Passives. Then subtract the percentage of Detractors from the percentage of Promoters. Here’s a simple formula: [(# Promoters ÷ # Respondents) – (# Detractors ÷ # Respondents)] x 100 = NPS.
Like many of the other metrics we’ve already covered, it’s important to measure your NPS at both the user and account level. This will help you understand where individuals may need more support, and give you a broad view into how well your app is perceived by your customers. This data can help you get ahead of problems and find fixes to keep your customers happy. And it’s a good early indicator of any customers who may be at risk of churning.
Mobile presents an unobtrusive opportunity to gather this NPS data. In-app NPS surveys tend to receive higher response rates than those served via email—because users can more easily contextualize their sentiment when they’re actively engaged with your product.
Why you should track NPS:
- Good indicator of user sentiment, happiness, and retention likelihood
- Helps you identify your Promoters, who could serve as great brand champions
- Enables you to spot Detractor trends so you can get ahead of them with fixes or new releases
- Highly informative when tracked over time and compared against feature releases
10. Poll and survey engagement
What do users think about your app?
In the highly competitive and fast-moving world of mobile, the importance of listening to your customers cannot be overstated. While polls and surveys aren’t true KPIs like the rest of the metrics included in this list, they’re often part of a more robust Voice of the Customer (VoC) program and are highly effective standalone methodologies for gathering user feedback.
For both polls and surveys, timing is everything. It’s important to make your questions visible without being overly intrusive. Think about your audience, when they’ll be most open to providing feedback, and how to best reach them in those moments.
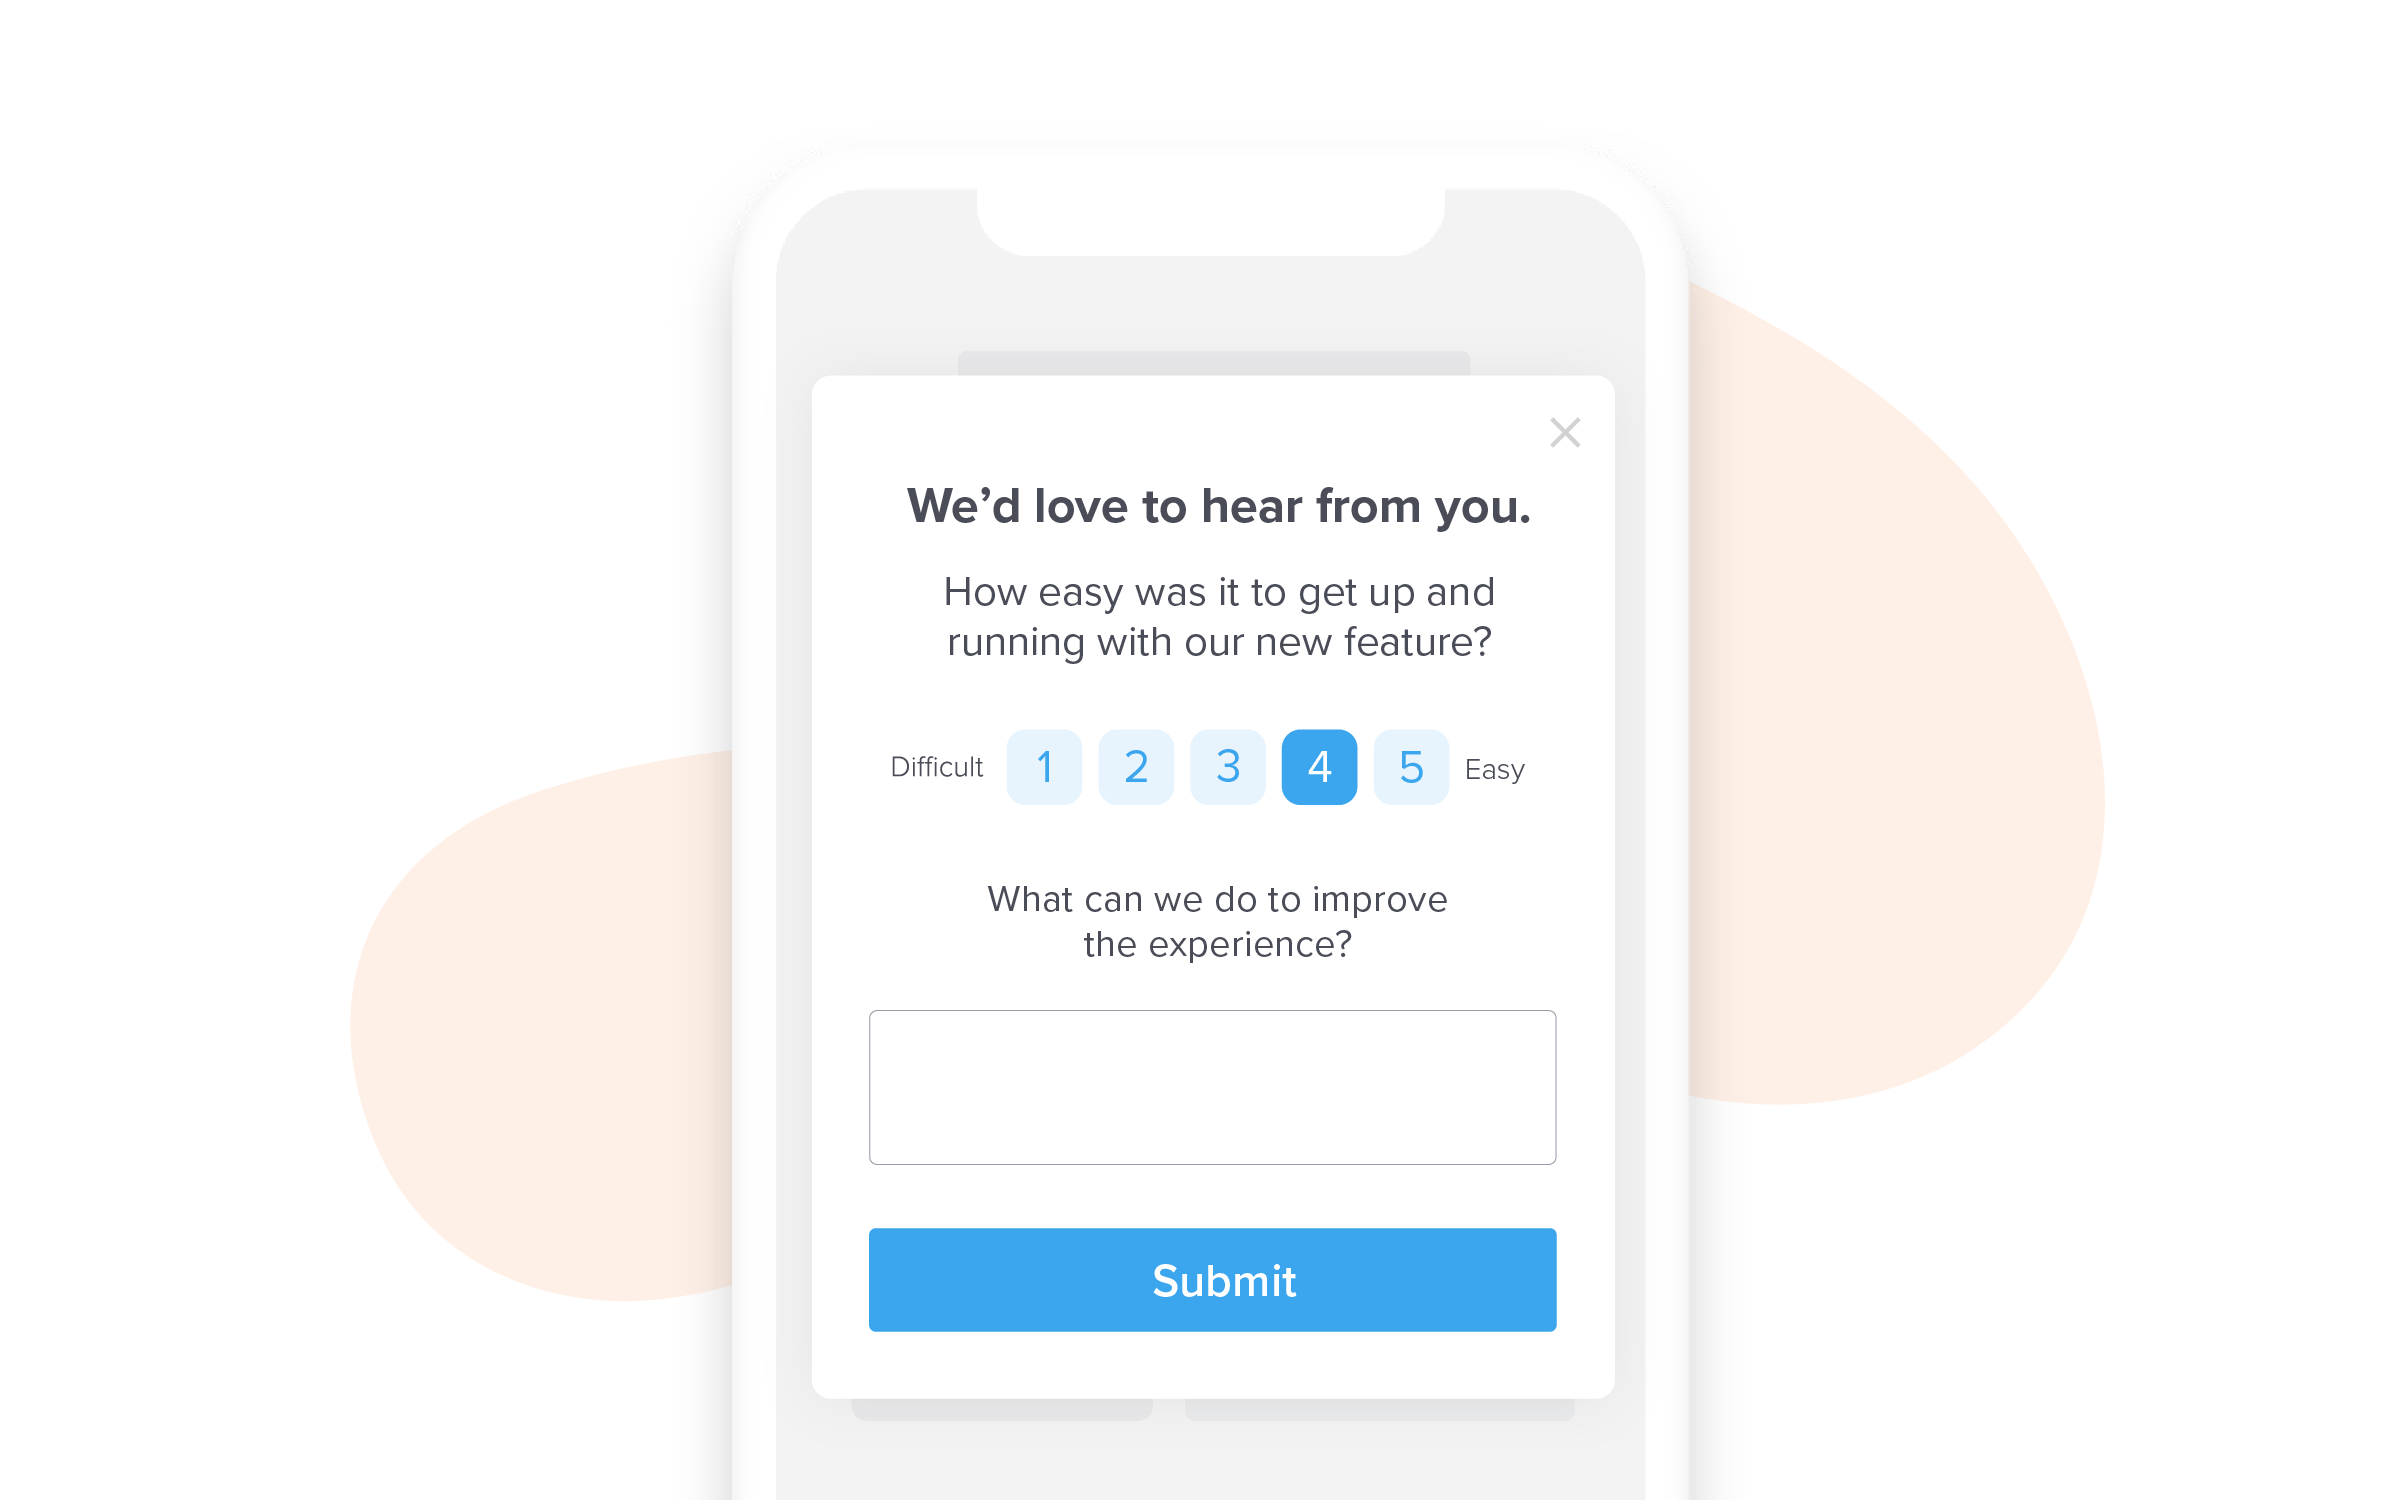
When it comes to mobile, in-app communication tends to perform best—because your users are already captive, and thus more willing to share their thoughts. The immediacy of surveying your users in-app is beneficial, too. You’ll receive more candid, timely feedback while your users are actually using your app—as opposed to retrospective feedback gathered in platforms that are further removed from the app experience.
The feedback you receive via polls and surveys can be a valuable source of inspiration for your mobile roadmap. It can help you easily spot sentiment trends, capture data about targeted and timely topics, identify frequently requested features or optimizations, and scale your broader VoC efforts.
Why you should track poll and survey engagement:
- Combines qualitative and quantitative data to give you a rounded picture of user sentiment
- Identifies trends that are often great indicators of what your product team should focus on next
- Improves user loyalty by demonstrating that you care about their input
- Helps fuel competitive advantage
Thanks for reading!
We hope this guide was a helpful run-through (or refresher!) of the top KPIs all mobile product leaders should track to keep their users happy and their business moving forward. Bringing a data-driven approach to your mobile development will ensure your team continues to work on the right things, keep your users happy, and drive competitive advantage for your business.
To learn more about how you can use data to better understand and guide your mobile users, request a custom demo of Pendo for Mobile.